
In our previous post, we discussed the paper “Abandon Statistical Significance”, which is a response to the paper “Redefine Statistical Significance” that has dominated the contents of this blog so far. The Abandoners include Andrew Gelman and Christian Robert, and on their own blogs they’ve each posted a reaction to our Bayesian Spectacles post. Below is a short response to their reaction to the discussion of the reply to the original paper. 🙂
1. Response to Andrew Gelman’s reaction
It would be interesting to examine the extent to which our different modeling perspectives yield different conclusions in actual practice. For each specific modeling problem, we might end up choosing a similar likelihood and a similar prior. On a side note, Andrew was wondering whether one of us (EJ) will blog about chess. Challenge accepted! The preliminary title of the intended blog post is “The most beautiful chess move that was never played” (hint: it’s Qg5).
2. Response to Christian Robert’s reaction
Christian discusses the discrepancy between the p-value and the Bayes factor (or, more to the point, the bound on the Bayes factor). He points out that
“Moving to a two-dimensional normal with potentially zero mean is enough to see the order between lower bound and p-value reverse, as I found [quite] a while ago when trying to expand Berger and Sellker (1987, the same year as I was visiting Purdue where both had a position). I am not sure this feature has been much explored in the literature”
Indeed, we are not aware of this, and it is definitely interesting. Jim Berger has noted somewhere that the reversal also occurs in sequential testing, where the frequentist has to correct for the planned number of tests. With a large enough number, the Bayes factor can indicate strong evidence against the null whereas the p-value would not be significant.
For instance, let’s assume that the frequentist plans a maximum sample size of 1200 for a two-group comparison, and intends to conduct a two-sided test after every 20 participants (ten in each group). This potentially yields 60 tests, necessitating an alpha-correction for each individual test. Now suppose after the first 20 participants, we obtain a result of p=.0049. But is this significant? The corrected alpha level (ensuring an overall 5% Type-I error rate) is .0048, so no, the result is not significant. That’s too bad! The Bayes factor, however, is immune to a researcher’s intentions (for details see the “Stopping Rule Principle” discussed by Berger & Wolpert, 1988); in JASP, an independent-samples t-test with a default Cauchy prior yields BF10 = 8.78, meaning that the data are about nine times more likely under H1 than under H0. So in sequential testing, it may happen that a data set does not produce a significant result at 𝛼 =.05, whereas the Bayes factor nevertheless indicates non-negligible evidence against the null.
Overall, we were relieved ecstatic happy to experience how pleasant this kind of online discussion can be. But we did promise to further discuss the flowchart from the previous post, so let’s press on:
The Flowchart Continued — Convincing a Skeptic
To refresh your memory, here is the null-hypothesis flowchart again:
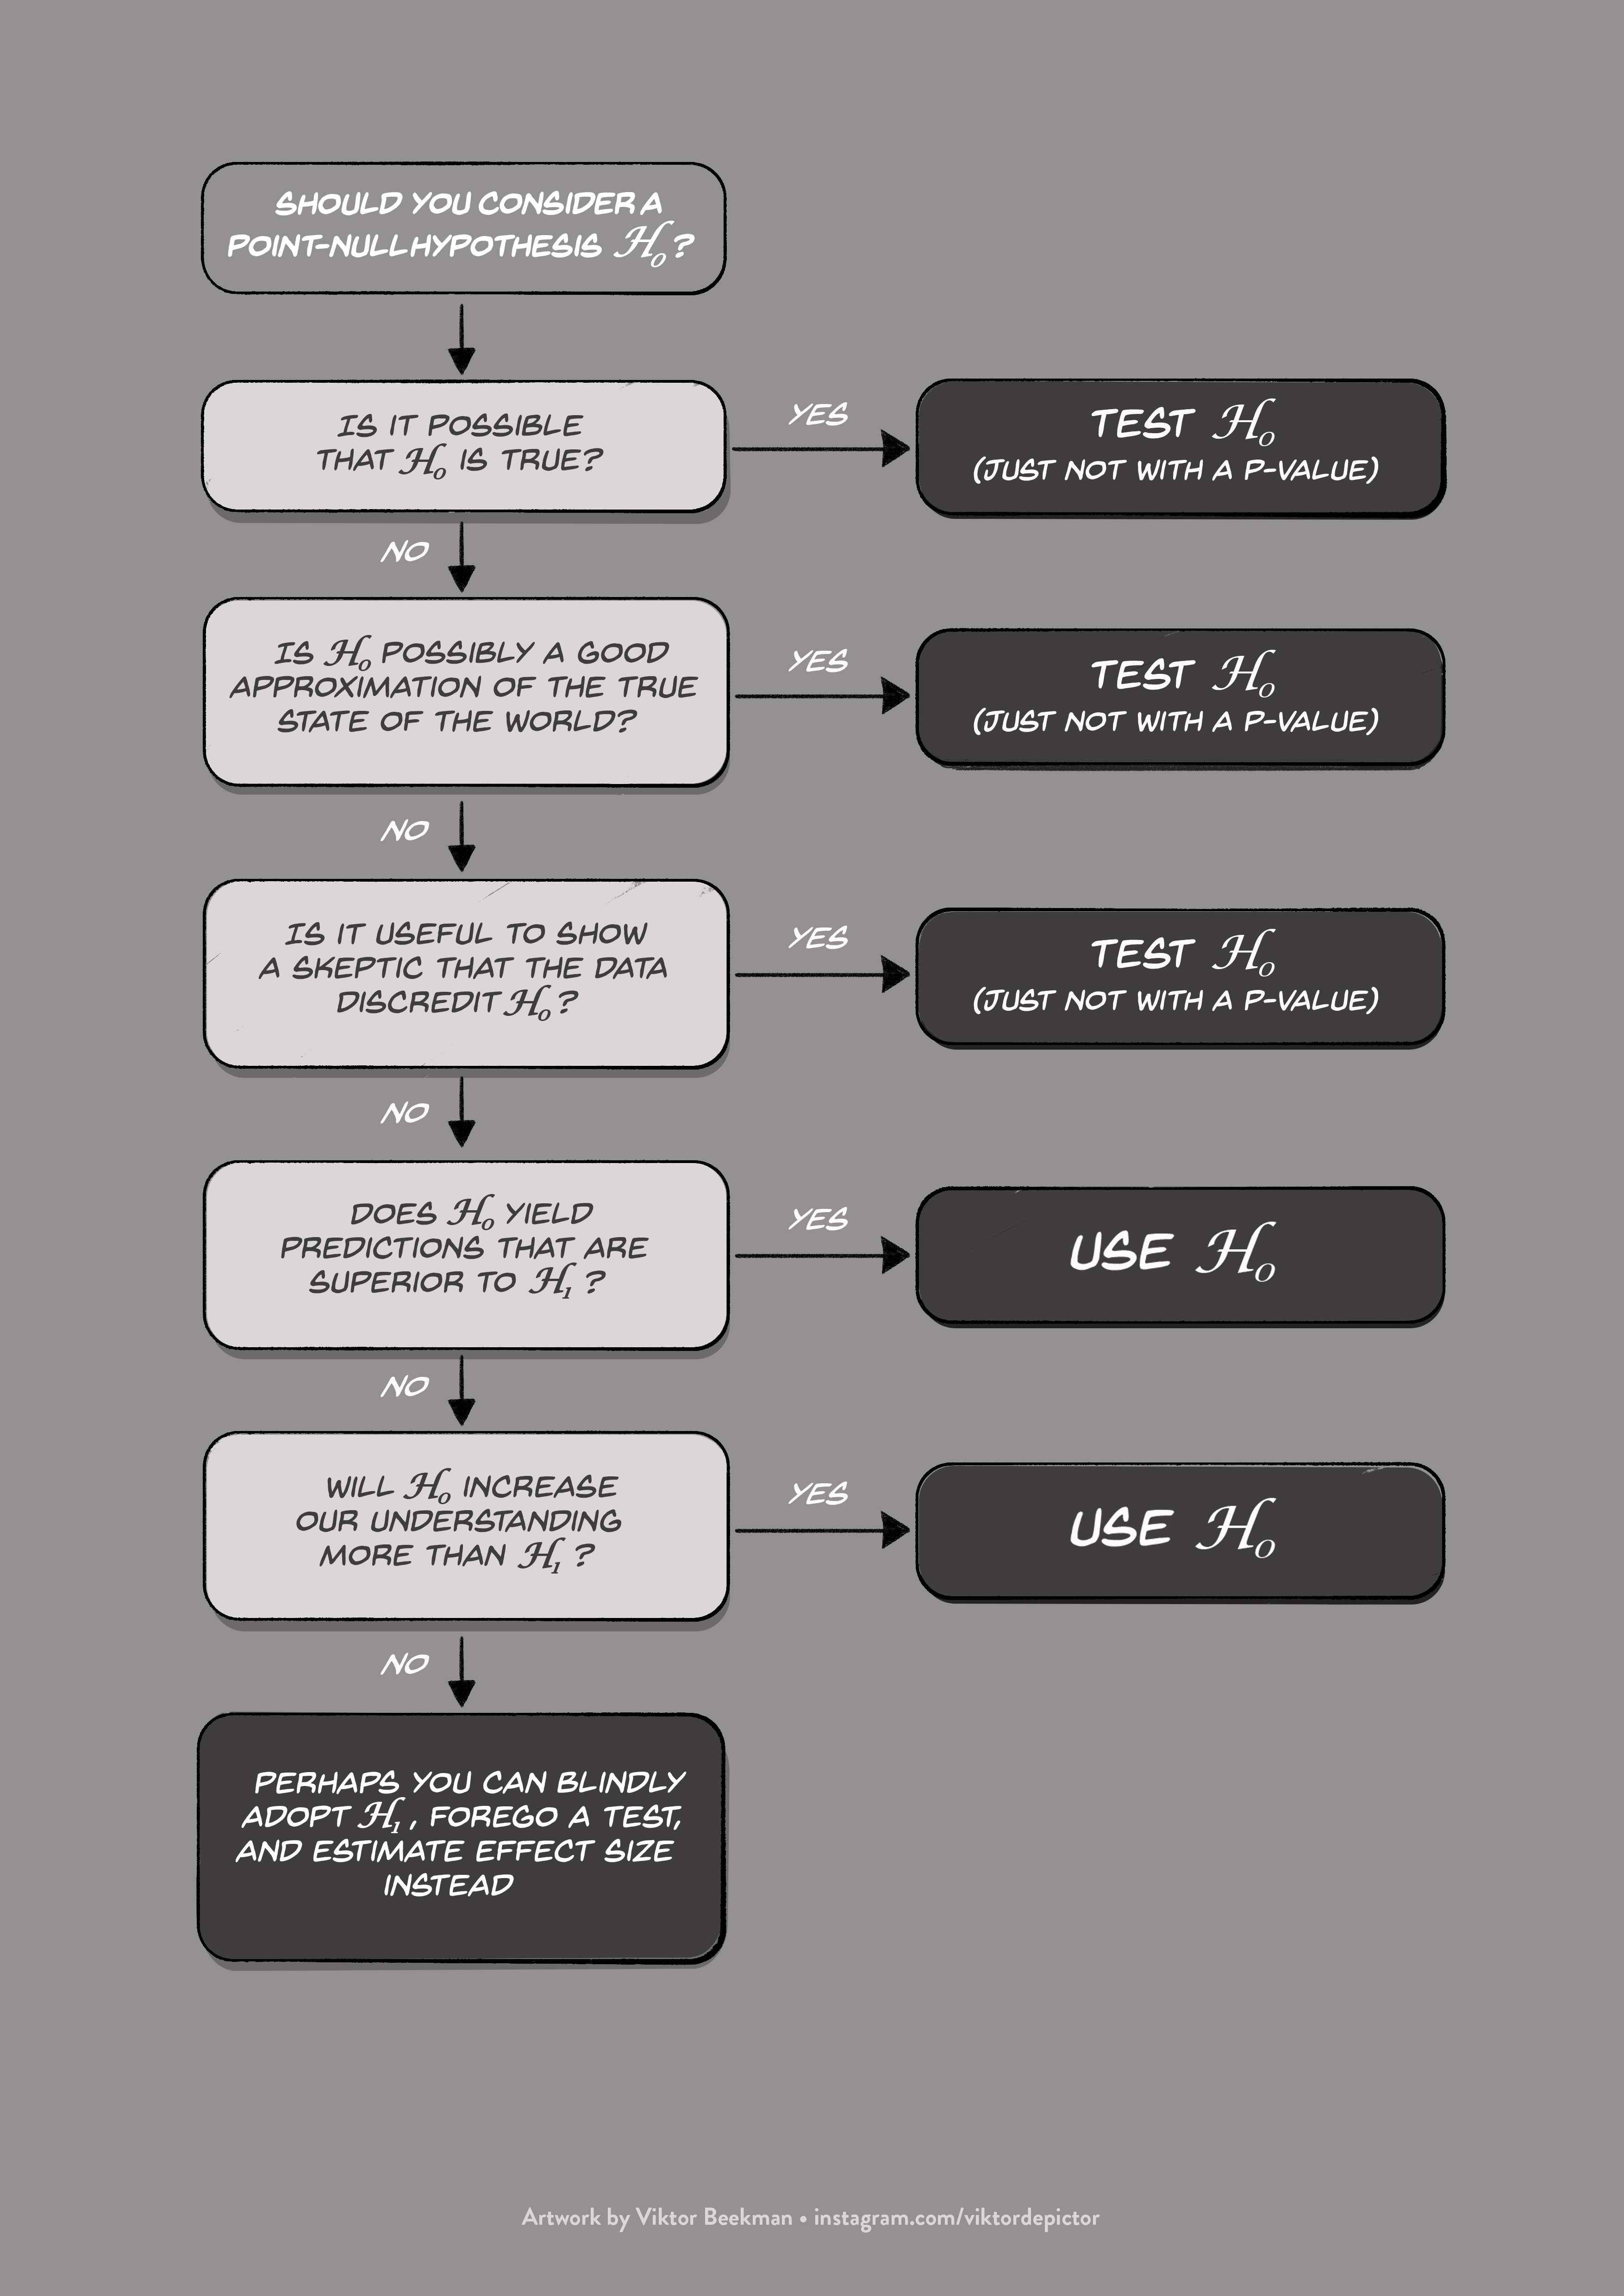
Figure 1. A flowchart to clarify the scenarios for which the point-null hypothesis is useful.
In the previous post we already discussed the first two choices, namely whether the point-null hypothesis could be true exactly, and whether it could be true approximately. But even when you know that the point-null is not true, not even approximately, it is can still be useful to test it.
Choice 3: Is it useful to show a skeptic that the data discredit the point-null hypothesis?
Skeptical Joe, Optimistic Amy, Ken The Explorer, and Rene The Impatient sit down in a bar and order a few drinks. After a while Amy starts to describe her empirical exploits and says, “My recent work supports the hypothesis that people with large pupils are more intelligent than people with small pupils” (Tsukahara, Harrison, & Engle, 2016 — NB: this is a reputable lab and we do not doubt this particular result). As Joe chokes on his beer, Ken adds, “Interesting. In my lab, we found that the Stroop effect decreases when people perform the task standing up” (Rosenbaum, Mama, & Algom, in press — side note: the conclusion is based on three preregistered experiments). Joe’s eyes widen, but Rene belches and says, “Science is so cool. We have discovered that among people with a history of post-traumatic stress disorder, amygdala activation correlates with levels of perceived stress (Tawakol et al., in press)”.
“OK guys,” says Joe, finally. “I may not know much about pupil size, Stroop effects, or the amygdala — but I do reserve the right to demand evidence that these effects really do exist, as you say they do. Were you able to demonstrate, for instance, that your data are more likely under a reasonable alternative hypothesis than under the point-null hypothesis? Surely, if this isn’t the case, your claims are statistically baseless and you may well have been interpreting noise.” Amy, Ken, and Rene exchange glances. “Joe obviously didn’t get the memo,” Amy mutters. Eyeing his drink, Ken smiles and says “Oops!”. Rene looks at Joe and says, “Dude. Don’t you know? The point-null has gone to meet its maker. Nobody considers the point-null even approximately true anymore. We are only interested in estimating effect sizes and reporting confidence intervals, obviously taking great care never to mention whether zero is inside or outside of the interval. This is the era of the New Statistics.”
Joe slams his beer on the table. “The New Statistics? I don’t know what the fork that means, but I do know that you guys want to claim that a particular phenomenon is real. And if you want to show that the data support that claim, logic demands that you confront the scenario of what the data would look like in case your claim is false. If you can’t show me that a plausible alternative hypothesis outpredicts the point-null, then I will simply ignore your findings. Wait, let me…” Putting his hands on the table, Joe slowly exhales. “OK, let me try again. You make the claim that a phenomenon exists. But you already assume, beforehand, that your claim is true, so you don’t feel obliged to provide any evidence. This is silly. Also, you are unwilling to demonstrate that the data discredit the point-null hypothesis, even though you apparently believe the point-null is wildly inaccurate. If you are unable to reject a wildly inaccurate hypothesis, I can only conclude that your data must be underwhelming.”
Amy’s face turns red, and, pointing one finger at Joe’s face, she says “Why should we care about a skeptical motherforker like you? If you would think about my research area for only 5 minutes, you would understand that the point-null is not true, not even approximately. So why would I need to prove something I already know?” Joe shakes his head, chugs his beer, and says “Well, good luck in the review process then!”
As this scene illustrates, empirical claims often concern the presence of a phenomenon. In such situations, any reasonable skeptic will remain unconvinced when the data fail to discredit the point-null. And in academia, Skeptical Joe’s are literally everywhere: they are action-editors, reviewers, colleagues, and you may even see one in the mirror. When your goal is to convince a skeptic, you cannot ignore the point-null, as the point-null is a statistical representation of the skeptic’s opinion. Refusing to discredit the point-null means refusing to take seriously the opinion of a skeptic. In academia, this will not fly.
A similar point was made by Edouard Machery on the Brains Blog Roundtable:
“Science is a social procedure that involves mechanisms by which phenomena are accepted. This is true in particle physics (5 sigmas significance level), epidemiology (consensus conferences and reports), climate science (Intergovernmental Panel on Climate Change), psychiatry (development of the DSM), etc.”
Take-Home Message
The point-null hypothesis is the statistical representation of the position of a skeptic. And in academia, skeptics live forever — kill one, and another rises from the ashes.
Like this post?
Subscribe to the JASP newsletter to receive regular updates about JASP including the latest Bayesian Spectacles blog posts! You can unsubscribe at any time.
References
Berger, J. O., & Wolpert, R. L. (1988). The likelihood principle (2nd ed.). Hayward (CA): Institute of Mathematical Statistics.
Rosenbaum, D., Mama, Y., & Algom, D. (in press). Stand by your Stroop: Standing up enhances selective attention and cognitive control. Psychological Science.
Tawakol, A., Ishai, A., Takx, R. A. P., Figueroa, A. L., Ali, A., Kaiser, Y., Truong, Q. A., Solomon, C. J. E., Calcagno, C., Mani, V., Tang, C. Y., Mulder, W. J. M., Murrough, J. W., Hoffmann, U., Nahrendorf, M., Shin, L. M., Fayad, Z. A., & Pitman, R. K. (in press). Relation between resting amygdalar activity and cardiovascular events: a longitudinal and cohort study. The Lancet.
Tsukahara, J. S., Harrison, T. L., Engle, R. W. (2016). The relationship between baseline pupil size and intelligence. Cognitive Psychology, 91, 109-123.
About The Authors

Eric-Jan Wagenmakers
Eric-Jan (EJ) Wagenmakers is professor at the Psychological Methods Group at the University of Amsterdam.

Quentin Gronau
Quentin is a PhD candidate at the Psychological Methods Group of the University of Amsterdam.


