The key point of the paper “Redefine Statistical Significance” is that p-just-below-.05 results should be approached with care. They should perhaps evoke curiosity, but they should not receive the blanket endorsement that is implicit in the bold claim “we reject the null hypothesis”. The statistical argument is straightforward and has been known for over half a century: for p-just-below-.05 results, the alternative hypothesis does not convincingly outpredict the null hypothesis, not even when we cheat and cherry-pick the alternative hypothesis that is inspired by the data.
The claim that p-just-below-.05 results are evidentially weak was recently echoed by the American Statistical Association when they stated that “a p-value near 0.05 taken by itself offers only weak evidence against the null hypothesis” (Wasserstein and Lazar, 2016, p. 132). Extensive mathematical arguments are provided in Berger and Delampady, 1987; Berger & Sellke, 1987; Edwards, Lindman, and Savage, 1963; Johnson, 2013; and Sellke, Bayarri, and Berger, 2001 — these papers are relevant and influential; in our opinion, anybody who critiques or praises the p-value ought to be intimately aware of their contents.
In a recent development, 88 authors posted a reply to the paper “Redefine Statistical Significance”. The title of this reply is “Justify Your Alpha”. Our opinion about this work is perhaps best conveyed with an analogy to the movie “Titanic”. Yes, the reply has many authors (some of whom we know and respect for their statistical insights and intellect) and at first glance the construction may look impressive. But the astute viewer knows full well that there are fatal design flaws, and a disastrous ending is in the offing. The ship will inevitably sink, and most of its crew will drown. And all because the crew underestimated the power of an iceberg. Had they only studied icebergs more carefully, they would have been aware of the hidden mass lurking below the surface…upon second thought, isn’t it irresponsible to sail the Arctic waters without knowing anything about icebergs?!
Anyway, as we argued in previous blog posts on the paper “Redefine Statistical Significance”, the core issue –and, as far as we are concerned, the only core issue– is that p-just-below-.05 results are evidentially weak and nondiagnostic. We have argued that for such results,
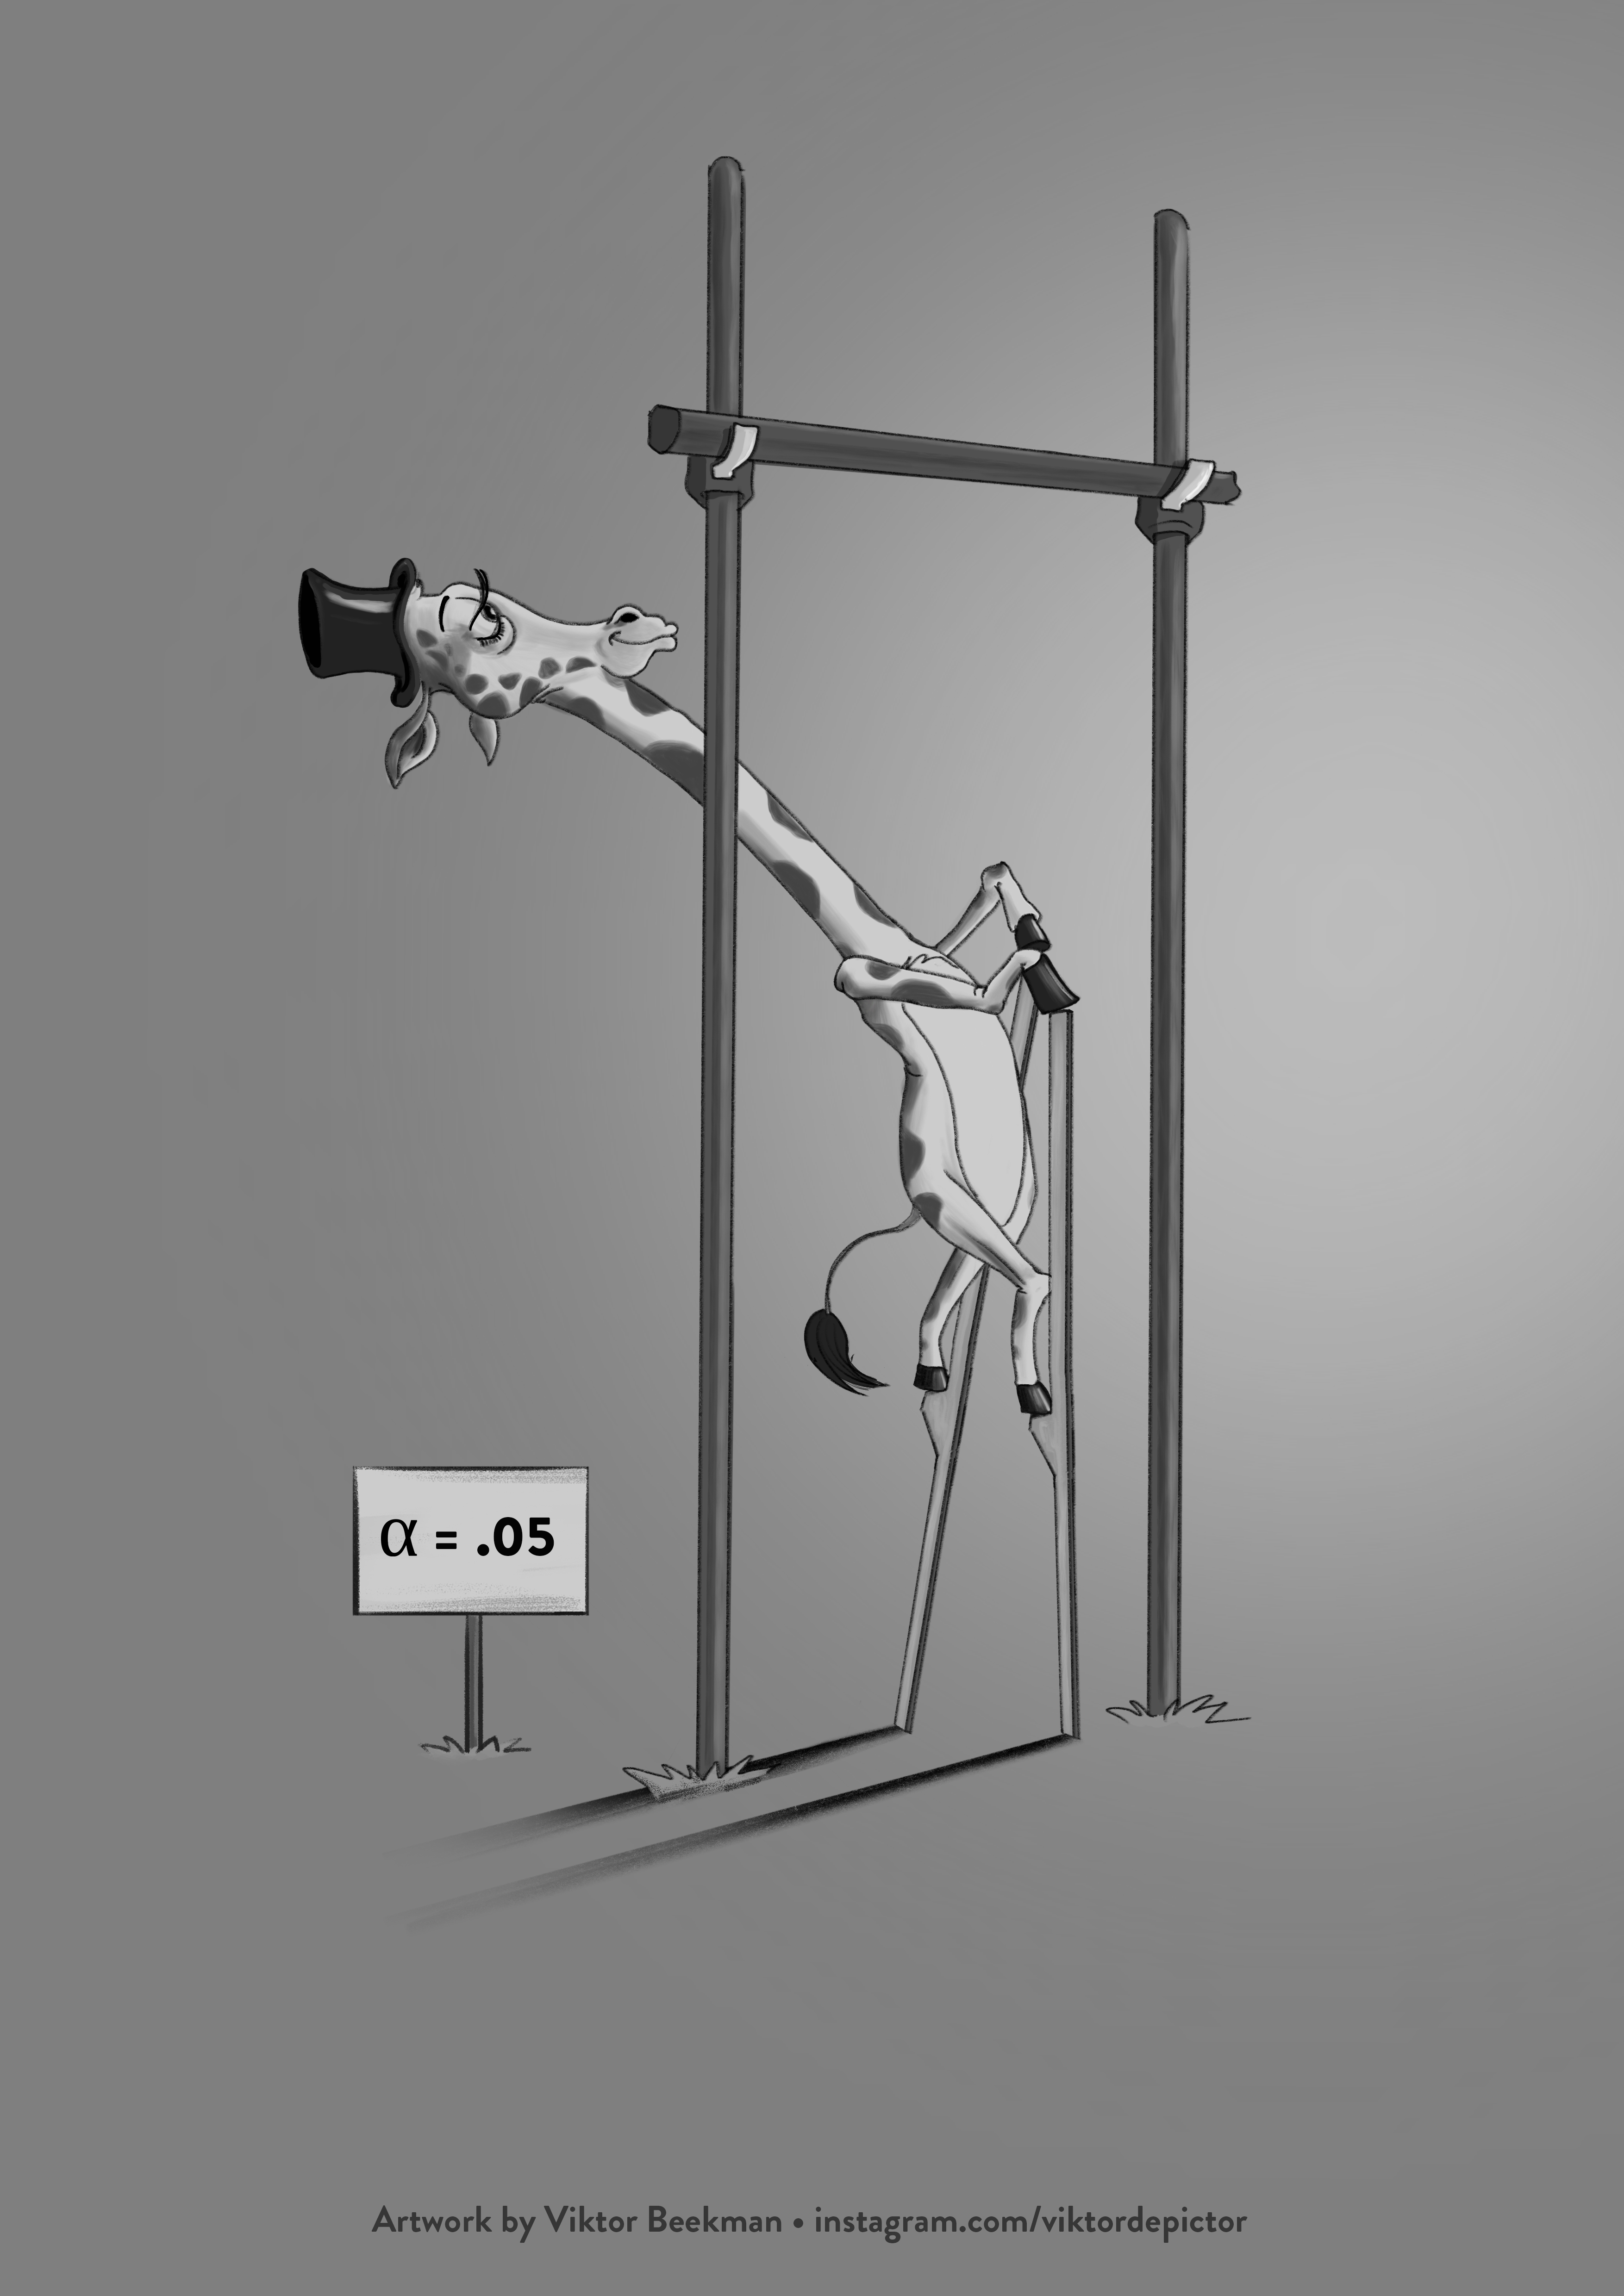
“the decision to ‘reject H0’ is wholly premature; the ‘1-in-20’ threshold appears strict, but in reality it is a limbo dance designed for giraffes with top hats, walking on stilts.”
How does the “Bring-Your-Own-Alpha” posse address this issue? How do they deal with the giraffe in the room? Well, they simply ignore it. All 88 crew members on the Titanic apparently believed the best course of action is to pretend icebergs do not exist. This main “argument” is apparent from the following statement:
“we argue against the necessity of a Bayesian calibration of error rates”
This only sounds statistically meaningful. The fact remains that for the subset of results that have p-just-below-.05, the evidence is weak. And a frequentist analysis would arrive at a similar conclusion, as long as it would condition on the observed data (or data in a specific range). Furthermore, the “argument” is just a statement that the reader is supposed to accept. But the statement itself is staggering. Imagine yourself a defendant in a court case. The judge issues the following ruling: “the available data have increased the likelihood that you are innocent. However, I have decided to convict you anyway. You see, I don’t believe in a Bayesian calibration of my error rates”. Clearly, such a judge is delusional — what matters is the evidence for the case at hand. Weak evidence ought not to result in a conviction.
Then there is a single paragraph about the Bayesian techniques used in the original paper. We comment on each of the statements below:
“Even though p-values close to .05 never provide strong ‘evidence’ against the null hypothesis on their own (Wasserstein & Lazar, 2016),
The ASA stated that “a p-value near 0.05 taken by itself offers only weak evidence against the null hypothesis” (p. 132)”. “Only weak” is semantically different from “never strong”.
(…) the argument that p-values provide weak evidence based on Bayes factors has been called into question (Casella & Berger, 1987; Greenland et al., 2016; Senn, 2001).
Let us see. The Casella & Berger paper promotes directional tests. We know that a directional test has a Bayesian interpretation as the posterior area to the left side of zero (see the blogpost on JASP and on Bayesian Spectacles). This was the message of the Casella & Berger 1987 paper. We also know that the directional test is not involved with a point-null. As far as testing a point-null hypothesis is concerned, this paper is therefore irrelevant. Next up is the Greenland et al. paper, an article that we highly recommend. It only says, on p. 342: “Nonetheless, many other statisticians do not accept these quantities [Bayes factors — EJ & QF] as gold standards, and instead point out that P values summarize crucial evidence needed to gauge the error rates of decisions based on statistical tests (even though they are far from sufficient for making those decisions).” This is hardly a compelling rebuttal of the claim that H1 does not outpredict H0 for p-just-below-.05 results. This leaves the paper by Senn (2001). This article mentions a few interesting aspects of Bayesian hypothesis testing (and is also highly recommended), but it does not address the results from the Redefine paper head on. More on that below.
Redefining the alpha level as a function of the strength of relative evidence measured by the Bayes factor is undesirable, given that the marginal likelihood is very sensitive to different (somewhat arbitrary) choices for the models that are compared (Gelman et al., 2013).
This refers to the standard critique against Bayes factors. But the argument from the original paper (presented in numerous earlier statistical articles) does *not* rely on any particular Bayes factor. Instead, the argument obtains its force and its general nature from being an **upper bound** on Bayes factors. This means that you can “bend your prior distribution like Beckham”, but within a large family of plausible prior distributions, you will not be able to obtain compelling evidence against the null (e.g., Berger & Delampady, 1987; Berger & Sellke, 1987; Edwards, Lindman, & Savage, 1963; Johnson, 2013; and Sellke, Bayarri, & Berger, 2001). This is the iceberg, and the “Bring-Your-Own-Alpha” crew has sailed straight into it, all the while singing Yo Ho Ho And a Bottle of Rum.
Benjamin et al. (2017) stated that p-values of .005 imply Bayes factors between 14 and 26, but the level of evidence depends on the model priors and the choice of hypotheses tested, and different modelling assumptions would imply a different p-value threshold.”
The “model priors” are not involved in the computation of the Bayes factor. What is involved, however, is the prior distribution for the parameters. Crucially, the point of the original paper was that, even if you cheat and cherry-pick this prior distribution, you still end up with Bayes factors that are not compelling, particularly for p-just-below-.05 results. Again, the original paper presents an upper bound argument.
In sum, this reply is a promising start to a meaningful discussion about the evidential value of P. We recommend that a revised version of the reply starts to address the crucial statistical argument from the original article. To make this more concrete, we challenge the authors to come up with any published p=.049 result, and try to produce a compelling and plausible Bayes factor against a point-null hypothesis. We wish all 88 crew members fair winds and following seas (in other words: good luck with that).
Like this post?
Subscribe to the JASP newsletter to receive regular updates about JASP including the latest Bayesian Spectacles blog posts! You can unsubscribe at any time.
References
Berger, J. O., & Delampady, M. (1987). Testing precise hypotheses. Statistical Science, 2, 317-352.
Berger, J. O., & Sellke, T. (1987). Testing a point null hypothesis: The irreconcilability of p values and evidence. Journal of the American Statistical Association, 82, 112-139.
Casella, G., & Berger, R. L. (1987). Reconciling Bayesian and frequentist evidence in the one-sided testing problem. Journal of the American Statistical Association, 82, 106-111.
Edwards, W., Lindman, H., & Savage, L. J. (1963). Bayesian statistical inference for psychological research. Psychological Review, 70, 193-242.
Greenland, S., Senn, S. J., Rothman, K. J., Carlin, J. B., Poole, C., Goodman, S. N., & Altman, D. G. (2016). Statistical tests, P values, confidence intervals, and power: A guide to misinterpretations. European Journal of Epidemiology, 31, 337-350.
Johnson, V. E. (2013). Revised standards for statistical evidence. Proceedings of the National Academy of Sciences of the United States of America, 110, 19313-19317.
Sellke, T., Bayarri, M. J., & Berger, J. O. (2001). Calibration of p values for testing precise null hypotheses. The American Statistician, 55, 62-71.
Senn, S. (2001). Two cheers for P-values? Journal of Epidemiology and Biostatistics, 6, 193-204.
Wasserstein, R. L., & Lazar, N. A. (2016). The ASA’s Statement on p-values: Context, process, and purpose. The American Statistician, 70, 129-133.
About The Authors

Eric-Jan Wagenmakers
Eric-Jan (EJ) Wagenmakers is professor at the Psychological Methods Group at the University of Amsterdam.

Quentin Gronau
Quentin is a PhD candidate at the Psychological Methods Group of the University of Amsterdam.


