
In our previous posts about the paper “Redefine Statistical Significance”, two concrete examples corroborated the general claim that p-just-below-.05 results constitute weak evidence against the null hypothesis. We compared the predictive performance of H0 (effect size = 0) to the predictive performance of H1 (specified by a range of different prior distributions on effect size) and found that for a p-just-below-.05 result, H1 does not convincingly outpredict H0. For such results, the decision to “reject H0” is wholly premature; the “1-in-20” threshold appears strict, but in reality it is a limbo dance designed for giraffes with top hats, walking on stilts.
The tar pit of p-value hypothesis testing has swallowed countless research papers, and their fossilized remains are on display in prestigious journals around the world. It is unclear how many more need to perish before there is a warning sign: “Tar pit of p-just-below-.05 ahead. Please moderate your claims”.
A Bayesian Interpretation of the One-Sided P-Value
A deeper appreciation of the p-value tar pit can be obtained by considering its Bayesian interpretation. Yes, that’s right: for some models, under some prior distributions, and under some sampling plans, p-values have a Bayesian interpretation (e.g., Marsman & Wagenmakers, 2017 and references therein). Specifically, when the alternative hypothesis H1 is from the exponential family and features a flat prior on a location parameter μ, then:
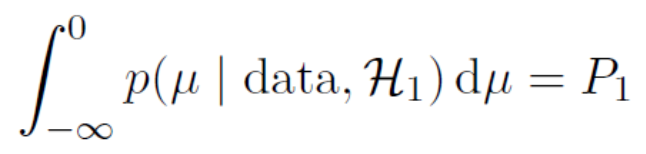
In words, the frequentist one-sided p-value, P1, equals the area of the posterior distribution to the left of zero, given that the alternative hypothesis is true. This insight has sometimes been used to argue for a unification of frequentist and Bayesian testing; unfortunately, the result does just the opposite — it reveals that p-values overstate the evidence against the null hypothesis.
The Bayesian interpretation of the one-sided p-value concerns a relatively simple question: given that the effect is present (i.e., conditional on H1, as in the above equation), is the effect positive or negative? Depending on the research context, this can be a useful question to address, but it differs fundamentally from the question that prisoners in the p-value gulags think they are answering. These wretched souls are under the impression that they test whether or not the point-null hypothesis is tenable, that is, whether the effect is present or absent. But the point-null hypothesis does not come into play in the Bayesian interpretation. Confused yet?
Clarification and Examples
From the Bayesian perspective outlined above, one-sided p-values are a test of direction: is the effect positive or negative? This question is often relatively easy to answer, because the competing models (i.e., H-: the effect is negative; H+: the effect is positive) make opposite predictions; therefore, the data are likely to be relatively diagnostic. In contrast, the question about presence vs. absence is more difficult. In most scenarios, the point null makes predictions that can also be made by the alternative hypothesis; instead of being opposite, the predictions now partly overlap, and the data are likely to be less diagnostic.
Let’s clarify this with an example. Recently I played a few games of Game of the Goose with my son Theo and lost 5-2. We can now ask two questions:
- Are Theo and I equally skilled (H0), or is Theo the better player (H1)?
- Is Theo the better player (H+), or am I the better player (H-)?
A 5-2 score is not that much more surprising under H0 than under H1, so we cannot confidently answer question 1. However, a 5-2 score is much more surprising under H- than under H+, so we can be more confident in our answer to question 2. The problem with p-values is that they can easily be misunderstood to answer the more difficult question (nr. 1) whereas they really address a much easier question (nr. 2).
To drive this point home let’s revisit our Bayesian reanalysis of flag priming. Using the Summary Stats module in JASP, the two-sided default Bayesian analysis yielded the following outcome:
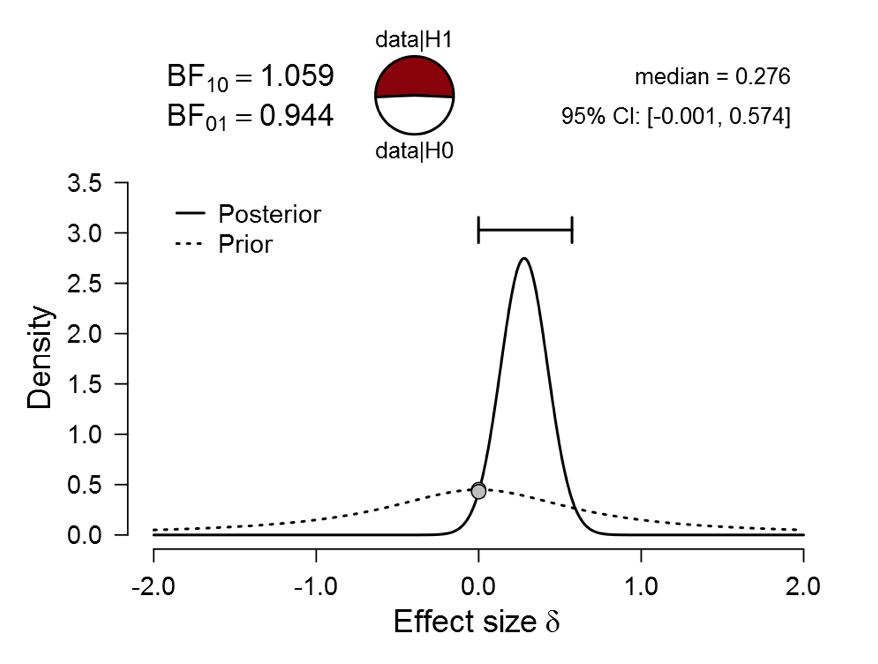
Figure 1. Bayesian reanalysis of data that give t(181) = 2.02, p = .045. The prior under H1 is a default Cauchy with location 0 and scale 0.707. There is virtually no evidence for H1 over H0, but at the same time there is evidence that the effect –should it exist– is positive instead of negative. Figure from JASP.
As Figure 1 demonstrates, there is almost no evidence against the null hypothesis, meaning that H0 and H1 predict the observed data about equally well. At the same time, when we disregard H0 and inspect the posterior distribution of effect size under H1, it is clear that the effect –should it exist– is positive rather than negative.
In sum, the one-sided p-value has a Bayesian interpretation, but only as an answer to a relatively easy question: what is the direction of an effect, assuming it exists? Many researchers appear to be interested in answering a much more difficult question: does the effect exist or does it not? These researchers need to be careful with p-values, especially with p-values that snuggle up to .05. A barely acceptable answer to an easy question can be entirely unconvincing for a more difficult question.
Like this post?
Subscribe to the JASP newsletter to receive regular updates about JASP including the latest Bayesian Spectacles blog posts! You can unsubscribe at any time.
References
Marsman, M., & Wagenmakers, E.-J. (2017). Three insights from a Bayesian interpretation of the one-sided P value. Educational and Psychological Measurement, 77, 529-539.
About The Authors

Eric-Jan Wagenmakers
Eric-Jan (EJ) Wagenmakers is professor at the Psychological Methods Group at the University of Amsterdam.

Quentin Gronau
Quentin is a PhD candidate at the Psychological Methods Group of the University of Amsterdam.


