Over 125 years ago, Raphael Weldon reported that out of a total of 315,672 dice throws, 106,602 (i.e., ≈33.77%) gave either a 5 or a 6. The excess chance is small (i.e., ≈0.44% more than 1/3) but the sample size is very large – what can we conclude about the dice? The analysis of the Weldon dice data encourages a reflection on the prior distribution, motivates a sensitivity analysis, and invites an assessment of the evidential flow. A synthetic data set is available here. The material from this blogpost is taken in large part from Wagenmakers & Matzke (2026).
Walter Frank Raphael Weldon (1860–1906) was an influential biometrician who, together with his friends Francis Galton and Karl Pearson, founded the journal Biometrika. Here we will focus on one of Weldon’s findings for which he is still regularly cited: the results from an ambitious dice-throwing experiment. The data have been subjected to frequentist analyses (for instance by Pearson and by Fisher) but they have also been studied by our Bayesian champion Harold Jeffreys, who provided a relatively detailed account of the setup:
A remarkable series of experiments was carried out by W. F. R. Weldon [footnote: Quoted by Pearson, Phil. Mag. 50, 1900.] to test the bias of dice. The question here was whether the chance of a 5 or a 6 was genuinely 1/3. In 315,672 throws, 106,602 gave a 5 or a 6. The ratio is 0.337699, suggesting an excess chance of 0.004366. We find (…) so that the odds are about 1600 to 1 in favour of a small bias. Extreme care was taken that a possible bias in the conditions of throwing should be eliminated; the dice were actually rolled, twelve at a time, down a slope of corrugated cardboard. The explanation appears to be that in the manufacture of the dice small pits are made in the faces to accommodate the marking material, and this lightens the faces with 5 or 6 spots, displacing the centre of gravity towards the opposite sides and increasing the chance that these faces will settle upwards.” (Jeffreys 1961, pp. 257–258)
In Jeffreys’s analysis, the null hypothesis claims that the chance θ = 1/3 that the die lands either 5 or 6. The alternative hypothesis relaxes the restriction on θ and assigns it a prior distribution. For the analysis of the Weldon data, Jeffreys used his default beta(1,1) prior, which is uniform from 0 to 1 (!). In light of our background knowledge concerning dice, this prior distribution is peculiar to say the least. Jeffreys was well aware of this, and defended his analysis by stating that the prior distribution did not really matter for the conclusion, since the Bayes factor was already about 1600 in favor of the alternative hypothesis, and a more adequate specification of H1 would only make the evidence stronger:
In the problem of the bias of dice, we supposed that the chance of a 5 or a 6, if the dice were biased, might be anything from 0 to 1. Now it may be said that this does not represent the actual state of knowledge, since it was already known that the bias is small. In that event we should have overestimated the permitted range and therefore K [i.e., BF01 – EW]; the evidence against q [i.e., H0] is therefore stronger than the test has shown. Now there is something in this objection; but we notice that it still implies that the test has given the right answer, perhaps not as forcibly as it might, but quite forcibly enough.” (Jeffreys 1939, p. 268, echoed in Jeffreys 1961, p. 332)
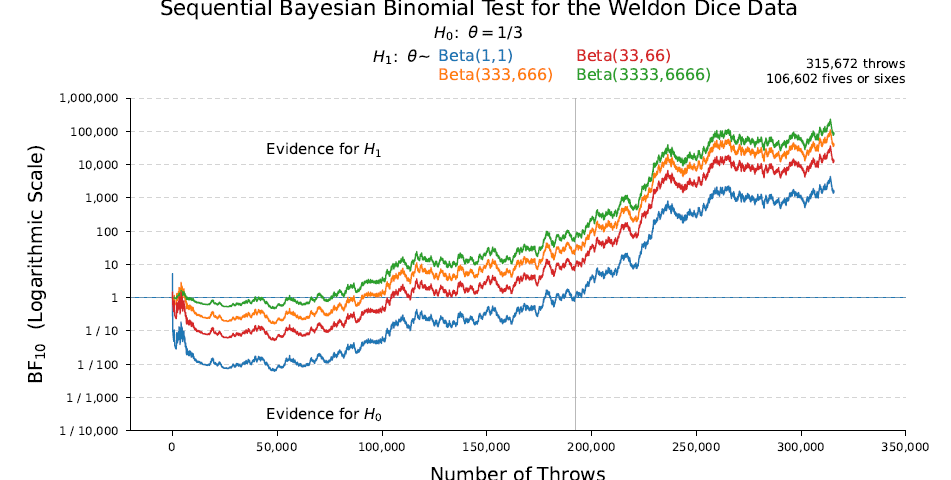
A synthetic Weldon data set (i.e., 106,602 occurrences of 5 or 6 out of 315,672 throws) allows us to compute the entire Bayes factor trajectory. The figure below shows the results for Jeffreys’s beta(1,1) prior as a blue line. When all the data are in, the beta(1,1) prior does yield compelling evidence against H0, in line with Jeffreys’s assertion. But what if Weldon had stopped after “only” 192,170 throws (henceforth: “Batch I”), when 64,768 occurrences of 5 or 6 yield a proportion of 64,768/192,170 ≈ 0.3370? The associated Bayes factor is almost precisely 1, and the data may be said to be predictively irrelevant. We may wonder what the conclusion would have been in case θ were assigned a less wasteful prior distribution…
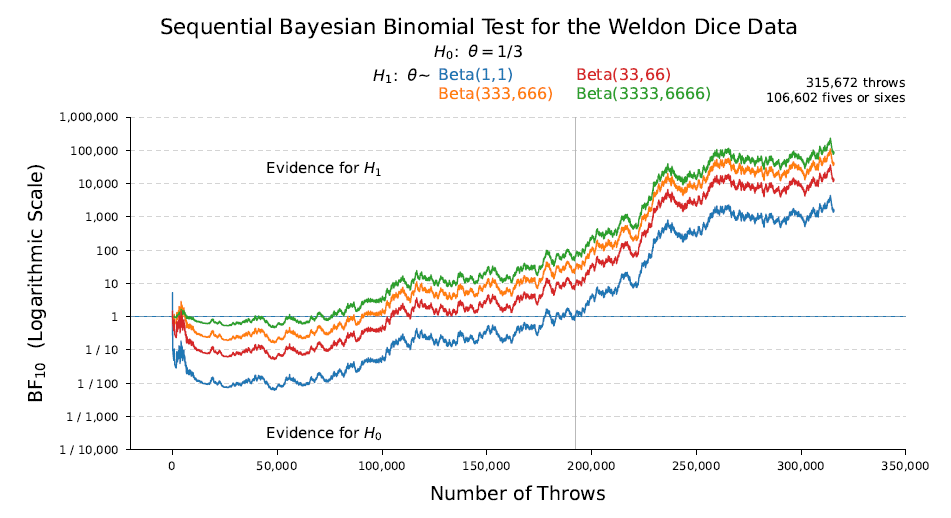 More realistic beta prior distributions concentrate mass around the value of 1/3 stipulated by the null hypothesis. The beta(33,66) prior (i.e., the red line in the figure above) is already much more reasonable that the beta(1,1) prior, and for Batch I yields a Bayes factor of 8.32 against H0. My own preference is towards beta priors that are even more concentrated: the beta(333,666) or beta(3333,6666) priors, which yield Bayes factors against the null of 25.73 and 61.29, respectively. In this particular example, I would argue that the informed priors reveal that the data from Batch I do provide strong evidence against H0. The table below summarizes the prior distributions and the associated results.
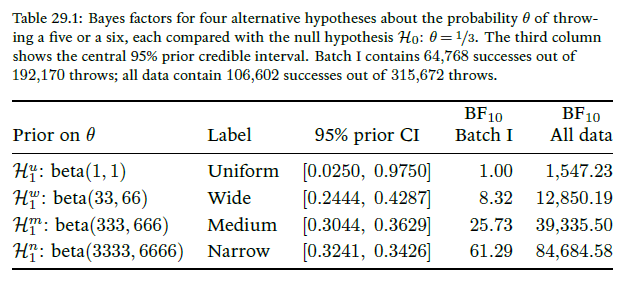
The Bayes factor trajectories show another interesting pattern: for all four beta priors, the trajectories seem to be almost identical apart from a constant vertical offset (on the log scale). An intuition for this general phenomenon is that, as the data accumulate, the four posterior distributions for θ quickly become very similar (“the data overwhelm the prior”; cf. Wrinch & Jeffreys, 1919). From that point onward, the models make near identical predictions. As a quantitative illustration, note that the data from the second batch drive the Bayes factor for the beta(1,1) prior from 1.00 to 1,547.23; for the beta(33,66) prior, the data from the second batch increase the Bayes factor in almost the same way: 8.32 x 1,547.23 = 12,872.95, close to the actual value of 12,850.19.
References
Jeffreys, H. (1939/1948/1961). Theory of Probability. Oxford: Oxford University Press.
Wagenmakers, E.-J., & Matzke, D. (2026). Bayesian Inference From the Ground up: The Theory of Common Sense. Manuscript in preparation.
Wrinch, D., & Jeffreys, H. (1919). On some aspects of the theory of probability. Philosophical Magazine, 38, 715-731.
Eric-Jan Wagenmakers
Eric-Jan (EJ) Wagenmakers is professor at the Psychological Methods Group at the University of Amsterdam.