This post is an extended synopsis of Stefan, A. M., Schönbrodt, F. D, Evans, N. J., & Wagenmakers, E.-J. (2020). Efficiency in Sequential Testing: Comparing the Sequential Probability Ratio Test and the Sequential Bay
Abstract
Analyzing data from human research participants is at the core of psychological science. However, data collection comes at a price: It requires time, monetary resources, and can put participants under considerable strain. Therefore, it is in the best interest of all stakeholders to use efficient experimental procedures. Sequential hypothesis tests constitute a powerful tool to achieve experimental efficiency. Recently, two sequential hypothesis testing methods have been proposed for the use in psychological research: the Sequential Probability Ratio Test (SPRT; Schnuerch & Erdfelder, 2020) and the Sequential Bayes Factor Test (SBFT; Schönbrodt et al. 2017). We demonstrate that while the two tests have been presented as distinct methodologies, they share many similarities and can even be regarded as part of the same overarching hypothesis testing framework. Therefore, we argue that previous comparisons overemphasized the differences between the SPRT and SBFT. We show that the efficiency of the tests depends on the interplay between the exact specification of the statistical models, the definition of the stopping criteria, and the true population effect size. We argue that this interplay should be taken into consideration when planning sequential designs and provide several recommendations for applications.
SPRT or SBFT? What’s the difference?
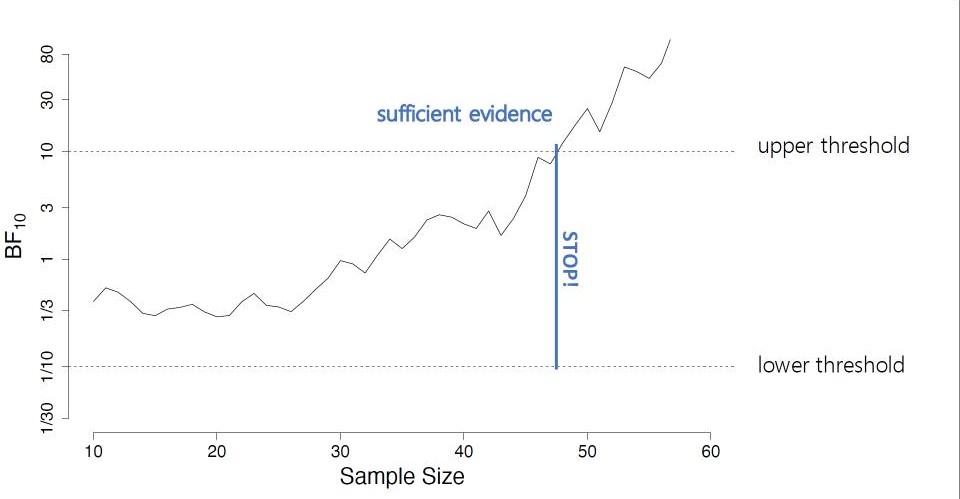
In sequential hypothesis tests, researchers terminate data collection when sufficient information has been obtained to decide between the competing hypotheses (Wald, 1945). To decide when to terminate the data collection, researchers monitor an analysis outcome as sample size increases. In the SPRT, this analysis outcome is a likelihood ratio; in the SBFT, it is a Bayes factor. As has been shown earlier, likelihood ratios and Bayes factors are closely related (see here for a visual display of the relationship). Both quantities measure the relative evidence for one hypothesis over another hypothesis, the only difference being that the Bayes factor incorporates prior uncertainty about parameters. This uncertainty is represented in the prior distribution, a probability distribution that assigns weights to different parameter values according to their prior plausibility. If all prior weight is assigned to a single parameter, the Bayes factor reduces to a likelihood ratio. Hence, the monitored outcome in the SBFT can be understood as a generalization of the monitored outcome in the SPRT.
A second defining characteristic of a sequential hypothesis testing procedure is the stopping rule. In the SPRT and SBFT, the stopping rule is based on assessing the position of the monitored outcome with respect to a lower and upper threshold. If the monitored outcome is smaller than the lower threshold, a decision for the null hypothesis is made; if the monitored outcome is larger than the upper threshold, a decision for the alternative hypothesis is made; if the monitored outcome lies between the thresholds, an additional data point is collected. The definition of thresholds directly influences the error rates and expected sample size of the design, and therefore, is key in determining the efficiency of the test. In the past, the SPRT and SBFT have typically relied on different lines of argumentation to justify the chosen thresholds. In the SPRT, the focal criterion has been error control (e.g., Wald, 1945; Schnuerch & Erdfelder, 2020); in the SBFT, the focal criterion has been the strength of evidence (Schönbrodt et al., 2017). However, as we show in our manuscript, the threshold definitions in the SPRT and SBFT are equivalent. Specifically, in both tests the thresholds define the strength of evidence needed to terminate data collection, and in both cases error rates can be directly controlled through threshold adjustment. Hence, researchers can apply the same principles of threshold definition to both sequential testing procedures, and determine optimal thresholds that provide exact error control via simulation.
Which test is more efficient?
Researchers employing sequential hypothesis testing procedures are often interested in maximizing design efficiency. Therefore, recent comparisons of the SPRT and SBFT have focused on the expected sample sizes in both procedures (e.g., Schnuerch & Erdfelder, 2020). However, we argue that these comparisons did not take the continuous nature of the relationship between the two tests into account. As discussed above, the tests become more similar if (1) the prior distribution in the SBFT assigns a high weight to the parameter values postulated in the SPRT, and (2) the stopping thresholds are derived based on the same principles. As a consequence, if an SBFT with a wide prior distribution and symmetric stopping thresholds is compared to an SPRT with nonsymmetric stopping thresholds, the results necessarily diverge and can lead to an overestimation of the differences between the methods. Thus, it is important to find a balanced way of comparison.
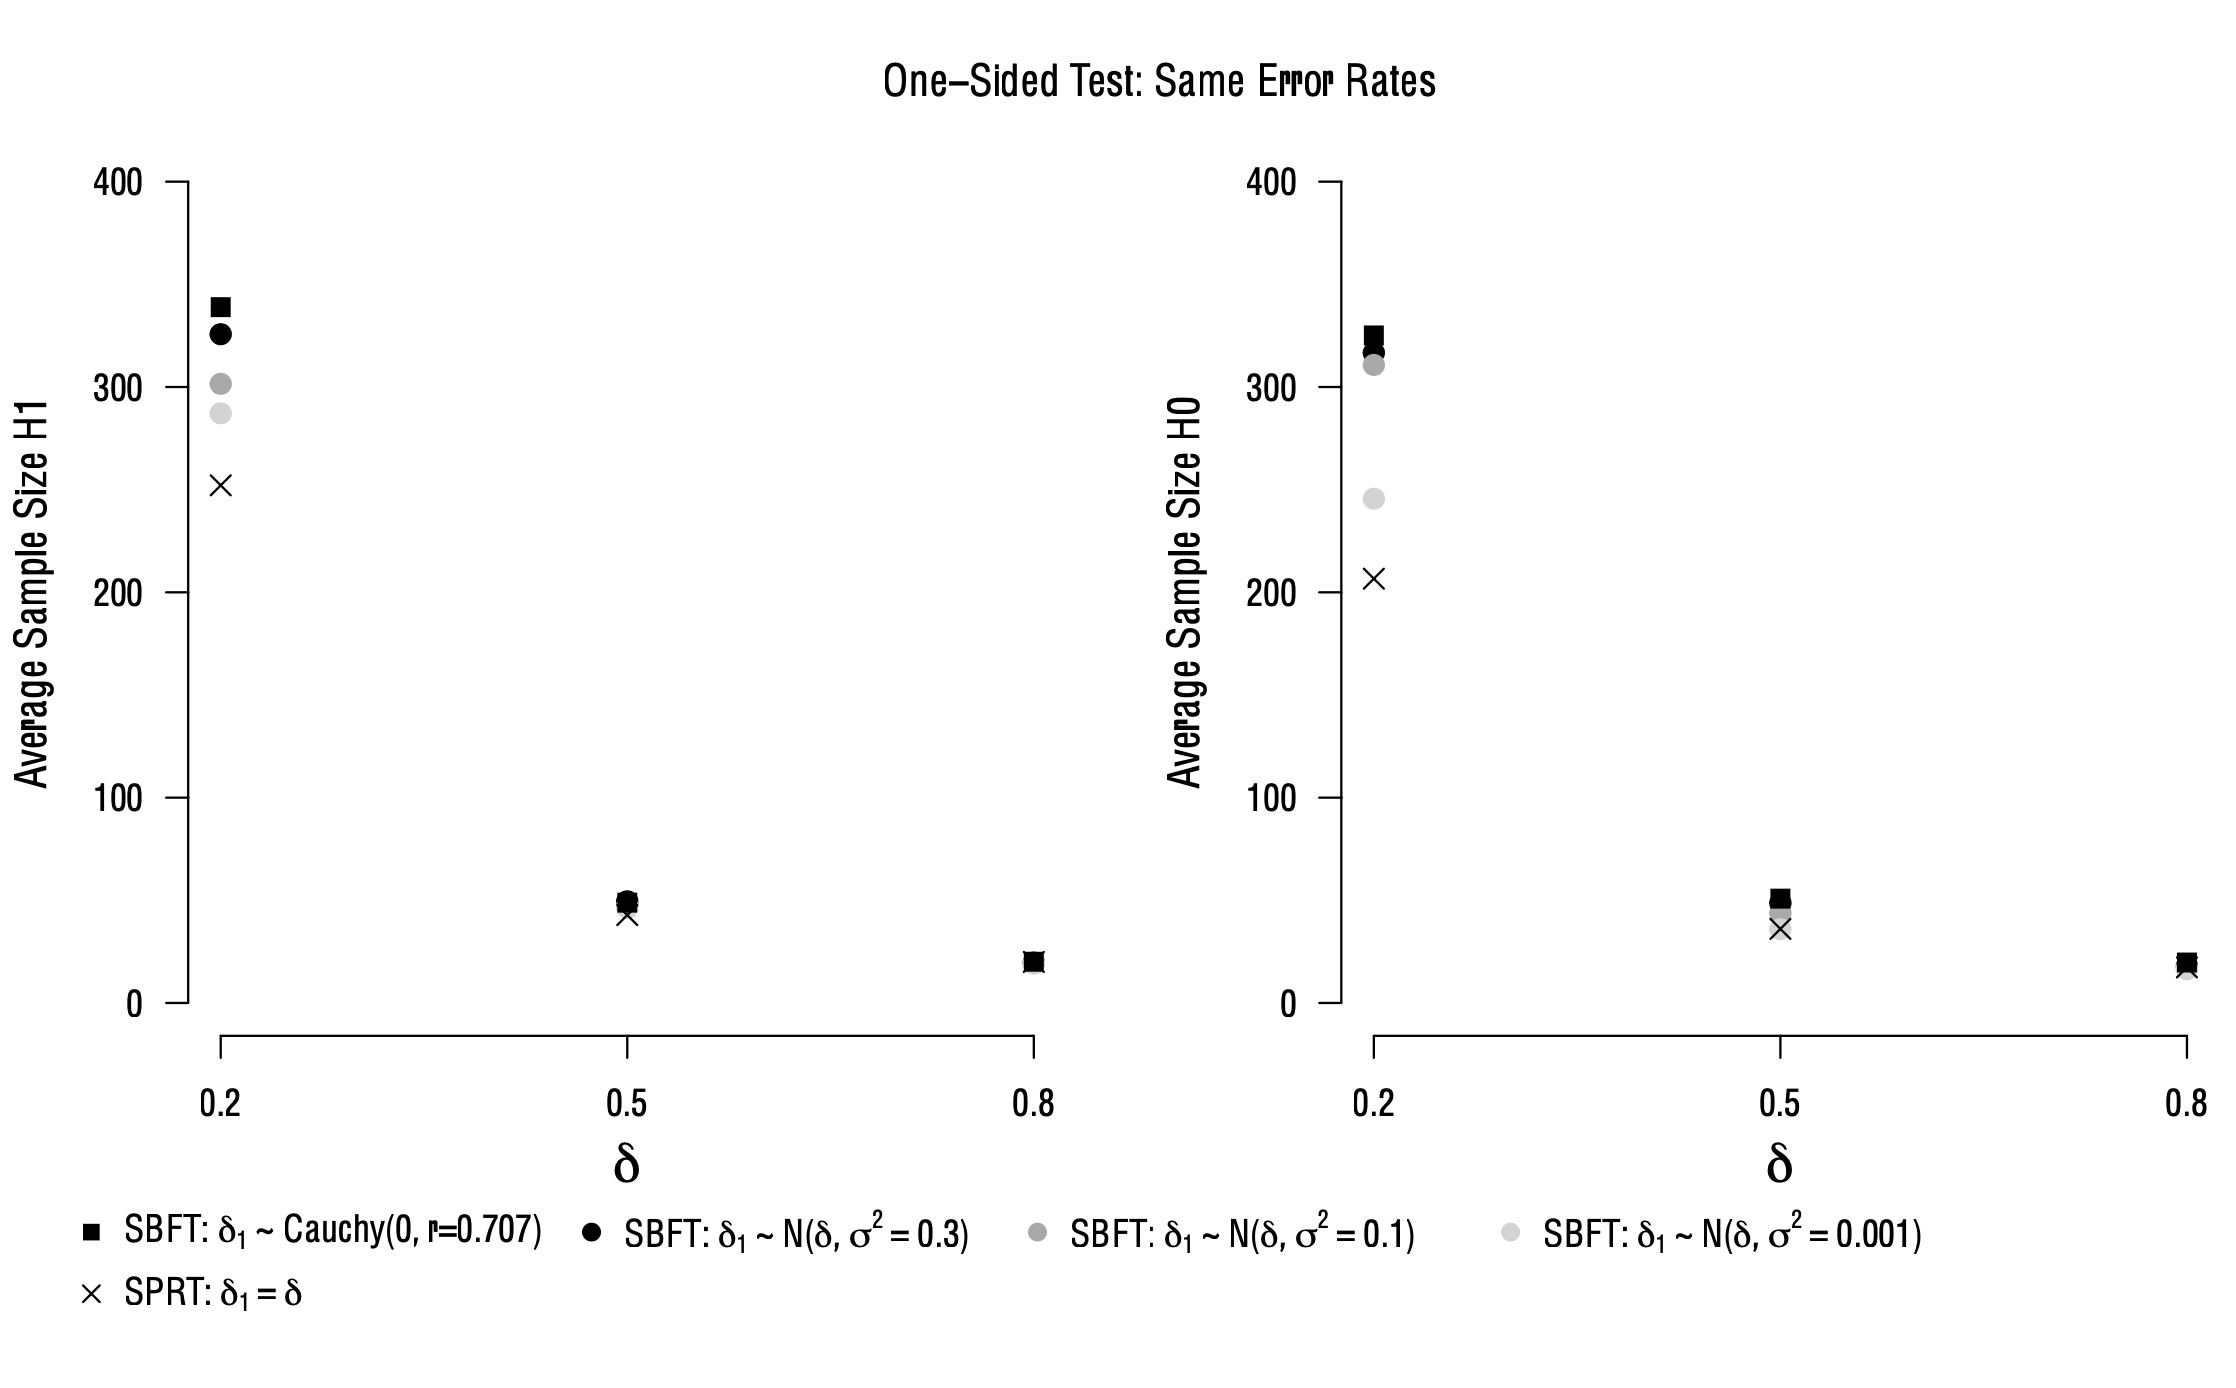
In the figure below, we show the results of such a balanced comparison where the stopping thresholds in both procedures were optimized to yield the same error rates. The comparison takes place under an oracle prior scenario, i.e., the true population effect size matches the parameter postulated in one of the SPRT models. In this instance, the prior uncertainty about the population effect size in the SBFT makes it less efficient than the SPRT, as the SPRT makes a precise, correct prediction about the true population effect size, compared to the more vague predictions of the SBFT. This is illustrated in the figure below: The SPRT consistently yields the smallest average sample sizes, and the results of the SBFT approach the SPRT as the width of the prior decreases (signaled by increasingly lighter round shapes). The largest difference between the SPRT and SBFT can be observed for a wide “default” prior distribution that assigns a high prior weight to a wide range of parameter values. Additionally, for all tests, expected sample sizes decrease if the population effect size is large, to the point where differences in efficiency between the tests are no longer visible.
Robustness Against Model Misspecification
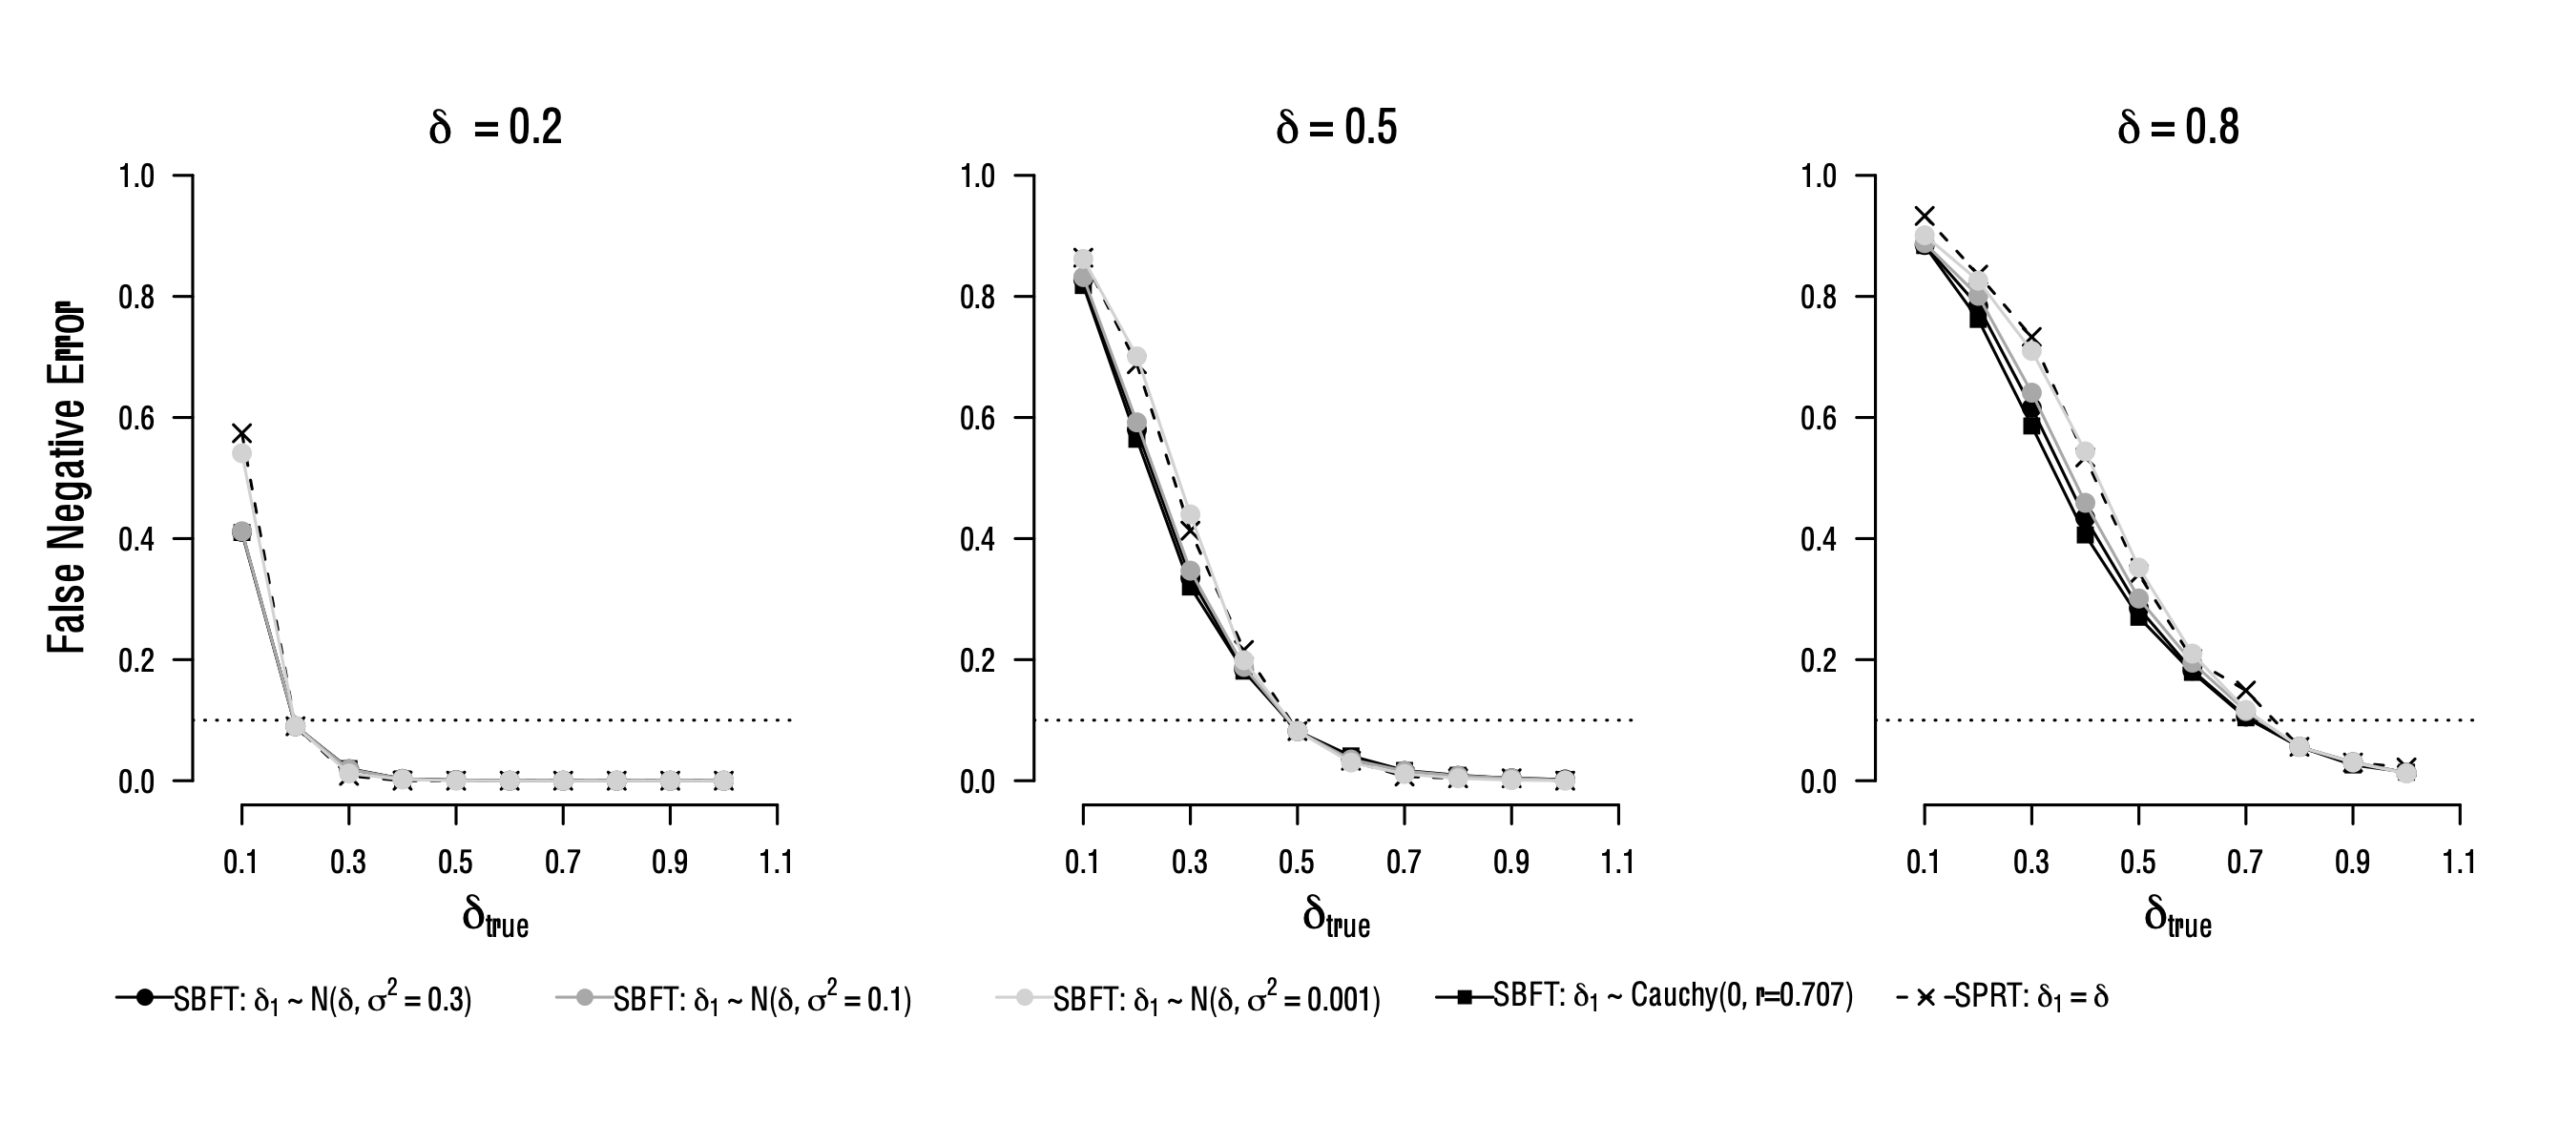
In real-life applications it is fair to assume that the specified models are rarely faithful representations of the true data generating process. This raises the question: What happens to the properties of the test if models are misspecified? The figure below shows the error rates of three designs where the true population parameter differs from the (most likely) parameter that was assumed in the model and in the design planning phase (displayed on top of each panel). In this instance, the prior uncertainty about the population effect size in the SBFT makes it more robust than the SPRT, as the SPRT makes a precise, incorrect prediction about the true population effect size, compared to the more vague predictions of the SBFT. As can be seen, the false negative error rate of the design substantially exceeds the nominal error rate if the true parameter is smaller than what was expected. This is particularly the case for the SPRT and the SBFT with a narrow prior distribution. Therefore, we can conclude that the SBFT with wide prior distributions generally requires larger sample sizes, but is more robust to model misspecification.
Practical Considerations for Design Planning in Sequential Testing
We hope that the previous sections clearly showcased that planning a sequential hypothesis test based on statistical evidence is not simply a dichotomous decision between SPRT or SBFT. Rather, researchers need to make decisions regarding several aspects of their test, which will determine the models and the testing framework they use. One important decision is about the incorporation of uncertainty in the models, which is possible only in the SBFT. The amount of uncertainty can be specified by means of the prior distribution. Another aspect researchers should consider are model predictions. Often, there is a conflict between testing efficiency and realistic model predictions. For example, a test comparing a null model and a model postulating a very large effect size might be very efficient in terms of sample size, but it might make implausible predictions about effect sizes that can be empirically observed. Researchers also need to decide how to balance strength of evidence, test efficiency, and error control when specifying the stopping thresholds of the design. Specifically, with wide thresholds, the test will yield strong evidence in favor of either hypothesis, and the probability of erroneous test decisions might be low, but large sample sizes will be required for the test to reach a conclusion. Conversely, thresholds that are optimized to yield a test with certain error rates with minimal sample sizes might not lead to strong evidence at the end of the test.
Taken together, we argue that researchers planning to use a sequential testing procedure should not only focus on the efficiency of the design, but also question whether the models are realistic representations of their substantive hypotheses and whether the test fulfills other desiderata, such as providing strong evidence. Based on their situation-specific evaluation of these design characteristics, researchers can configure the sequential hypothesis test to their needs within the unified framework of SPRT and SBFT.
References:
Schnuerch, M., & Erdfelder, E. (2020). Controlling decision errors with minimal costs: The sequential probability ratio t test. Psychological Methods, 25(2), 206–226. https://doi.org/10.1037/met0000234
Schönbrodt, F. D., Wagenmakers, E.-J., Zehetleitner, M., & Perugini, M. (2017). Sequential hypothesis testing with Bayes factors: Efficiently testing mean differences. Psychological Methods, 22(2), 322–339. https://doi.org/10.1037/met0000061
About The Authors

Angelika Stefan
Angelika is a PhD candidate at the Psychological Methods Group of the University of Amsterdam.

Felix Schönbrodt
Felix Schönbrodt is Principal Investigator at the Department of Quantitative Methods at Ludwig-Maximilians-Universität (LMU) Munich.

Nathan Evans
Nathan Evans is an ARC DECRA Research Fellow at the University of Queensland.

Eric-Jan Wagenmakers
Eric-Jan (EJ) Wagenmakers is professor at the Psychological Methods Group at the University of Amsterdam.