Summary
In the popular indoor mall “Hilvertshof”, in the Dutch town of Hilversum, on Monday October 12th, 2020, at about 3 pm, I counted 175 adults wearing a face mask, and 261 adults not wearing a face mask, for a mask wearing percentage of about 40%. Based on this data collection experience, I also offer four conjectures that future research may confirm or undercut: (1) teenagers (whose data are not included) wear masks relatively rarely, and prefer to engage in public displays of group hugging instead; (2) there are large individual differences in how careful people are; (3) if masks are worn, they are always almost worn well — only 10 out of 185 people (i.e., about 5%) wore the mask manifestly wrong (e.g., on the chin, in the hand, not covering the nose); (4) The recommended 1.5 meter distance is universally violated.
Design
In my home country, The Netherlands, the number of COVID infections continues to rise at an alarming rate. To indicate the gravity of the situation, Dutch citizens can only travel to countries such as Germany and Italy(!) when in possession of a recent negative corona test or the willingness to undergo quarantine. Today the Dutch government will indicate additional restrictions to curb the spread of the disease, and these restrictions may involve the requirement to wear face masks in indoor public spaces such as in shopping malls and supermarkets. At the time of writing, the Dutch government has “urgently advised” people to wear face masks in indoor public places, but this is a recent development. In other words, masks are not mandatory. I will not discuss this policy choice here; instead, I decided to conduct a short, informal observational study about the prevalence of mask use.
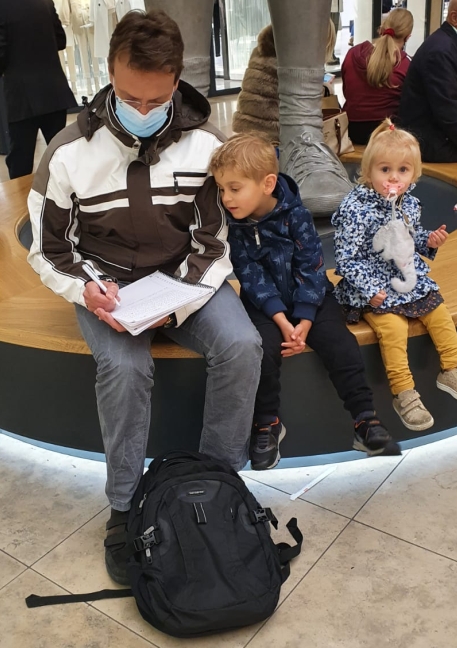
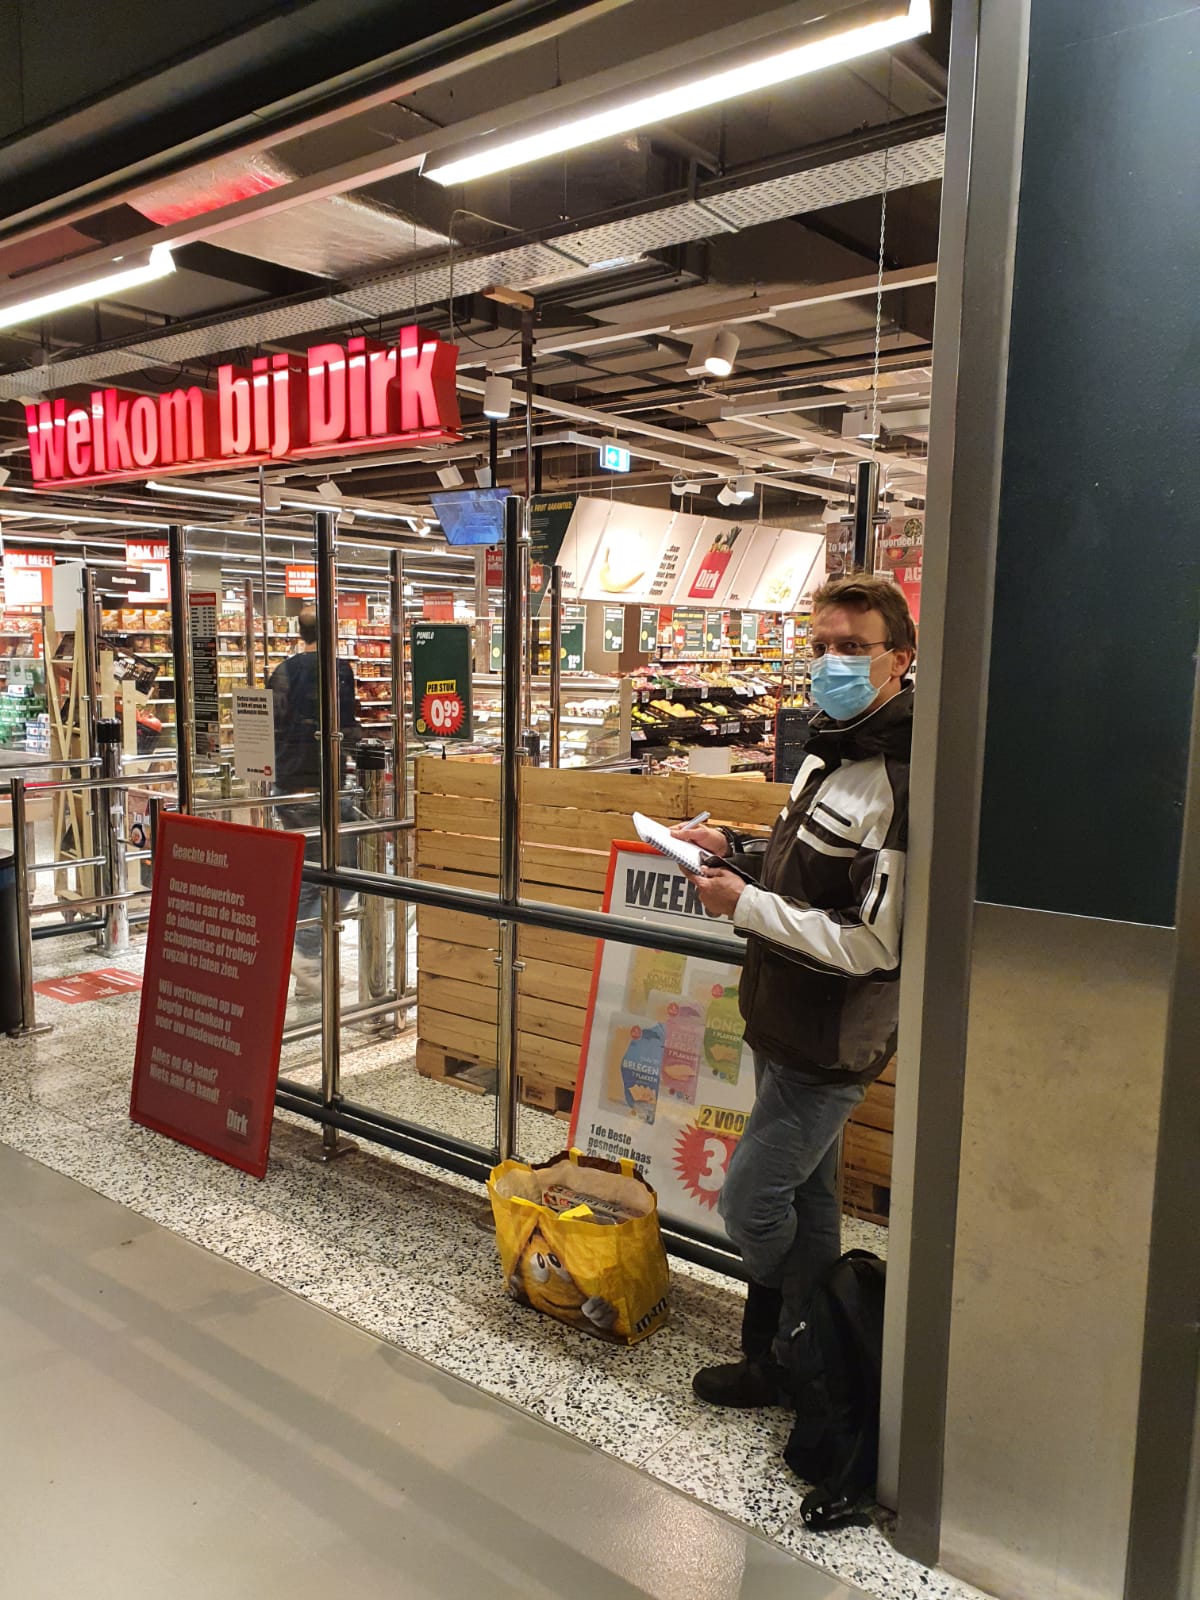
Specifically, I visited a popular Dutch indoor mall, “Hilvertshof” in Hilversum (35 stores, 3 floors, 24,000 square meters), sat down with pen and paper at a strategic position, and tallied whether shoppers were wearing a mask or not. I did this for half an hour, from 3:20 pm to 3:50 pm. I excluded children (i.e., all non-adults, so teenagers were also excluded), and indicated people whose classification was ambiguous (e.g., “wearing” the face mask on the chin, holding it in their hand, etc.) by a question mark — they were excluded from the analysis. The photo provides an impression of the setup.
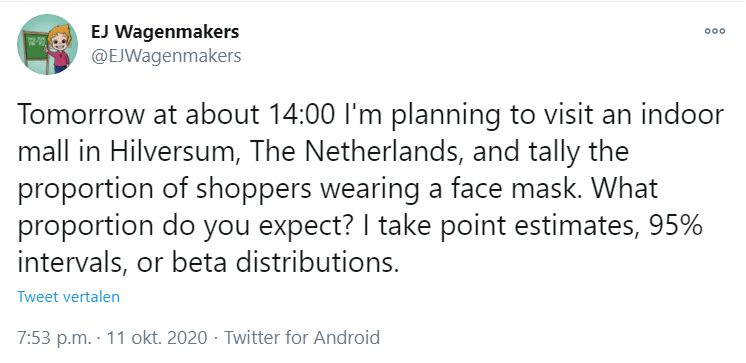
The reason for this study was twofold. First, there appears to be considerable uncertainty about the number of people who voluntarily wear face masks in The Netherlands. The day before the measurement I sent out a tweet asking for an expectation about the proportion of mask-wearers in Hilvertshof:
Below I summarize the 46 point estimates (some people gave beta distributions for the unknown chance — I took the mean of each beta distribution as a point estimate). It is clear that expectations vary substantially.
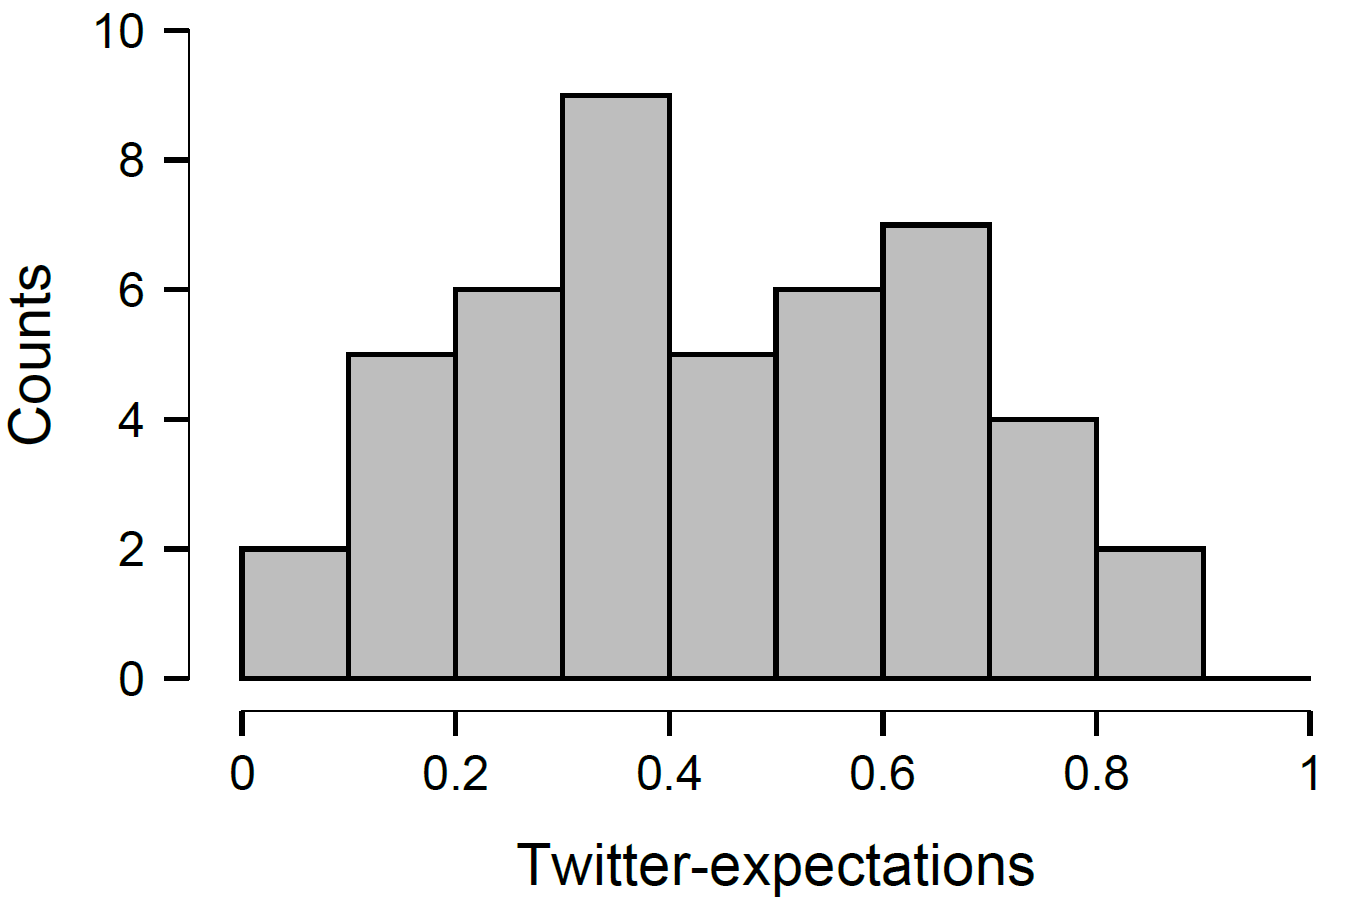
Figure 1. A histogram of 46 point estimates (each generously provided by a different Twitter user) for the proportion of people in an indoor mall in Hilversum that wear face masks. The expectations span almost the entire scale.
A second reason to collect these data was because they can be used to illustrate the ease of doing a Bayesian analysis. All that is required is to specify a prior distribution for the unknown proportion; incoming data then update this distribution, reallocating plausibility toward values of the unknown proportion that are relatively consistent with the observed data, and away from values that are relatively inconsistent with the observed data.
The Data
In 30 minutes of observation time, I counted 175 adults wearing a face mask, and 261 adults not wearing a face mask, which yields 40.1% of mask wearing. The associated posterior distribution (obtained by updating a uniform beta(1,1) prior distribution) is shown below:
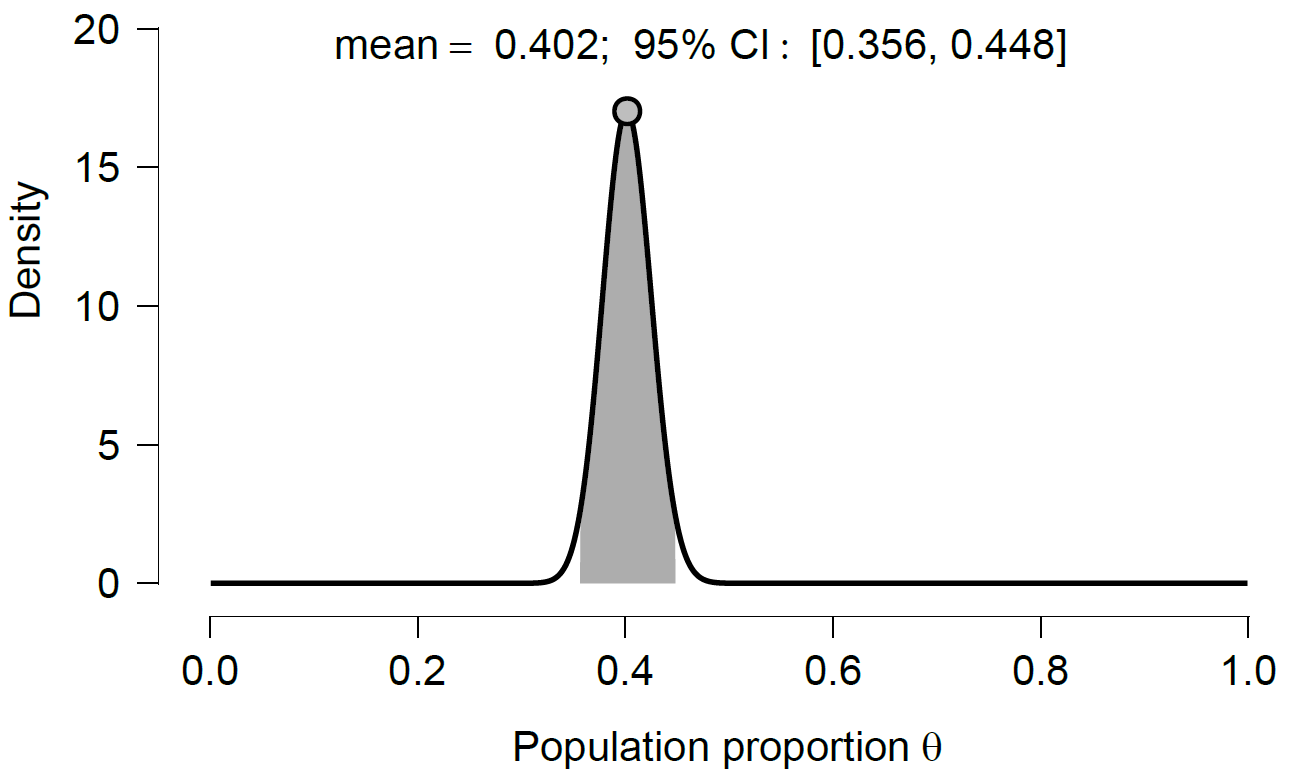
Figure 2. Posterior distribution for the chance that a given person walking into Hilvertshof (i.e., the indoor shopping mall in Hilversum) wears a face mask. The prior is uniform from 0 to 1 (not shown). Plot from the Learn Bayes module in JASP (included in the next version, out soon).
I stopped data collection because I ran out of time, but I could instead have monitored the width of the posterior distribution and stopped as soon as it was sufficiently narrow (e.g., Berger & Wolpert, 1988; Wagenmakers, Gronau, & Vandekerckhove, 2019 ). A sequential plot demonstrates how the posterior distribution becomes more peaked as the observations accumulate:
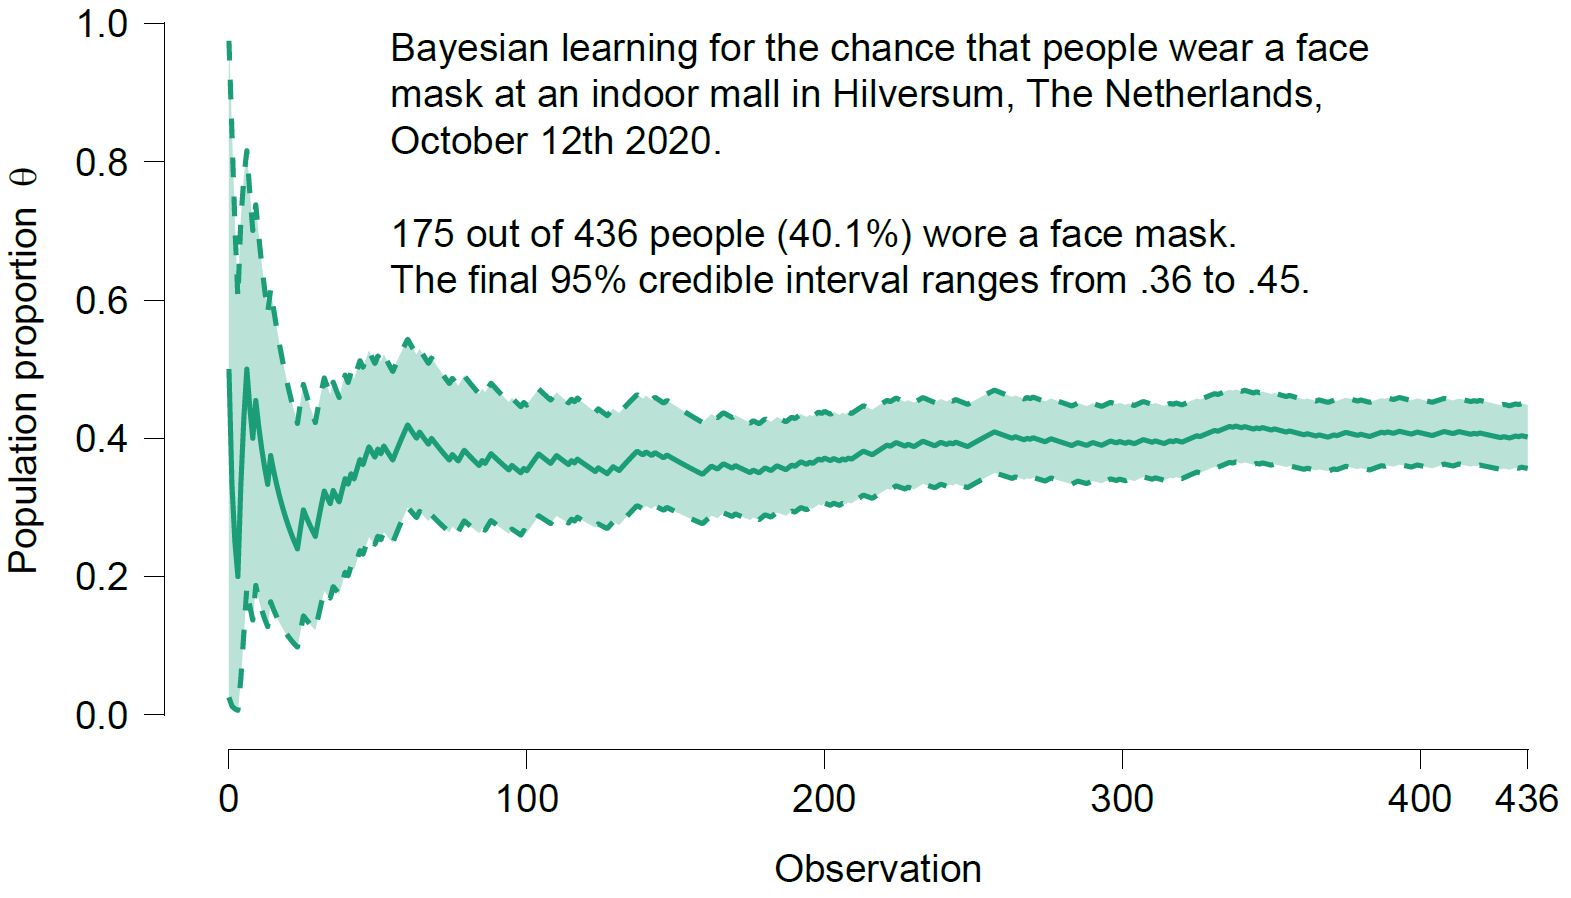
Figure 3. Sequential updating of the posterior distribution for the chance that a given person walking into Hilvertshof (i.e., the indoor shopping mall in Hilversum) wears a face mask. The prior is uniform from 0 to 1. Plot from the Learn Bayes module in JASP (included in the next version, out soon).
Finally, I also classified 10 people as “ambiguous”; these people clearly did not wear their masks properly.
How About Supermarkets?
It is possible that those who visited the indoor mall without a mask would start wearing it as soon as they entered a particular store. To study this possibility I collected a small additional data set of 100 people entering the supermarket inside Hilvertshof (the “Dirk”). See below for a photo of the setup:
The Dirk observations showed that 42 out of 100 customers were wearing face masks. The Dirk sample proportion of .42 is not markedly different from the .40 in the general mall setting, and a default comparison of two proportions (e.g., Gronau et al., 2019) yields some evidence in favor of the null hypothesis that the proportions in the two settings are equal. This was somewhat surprising to me, as I had expected that mask wearing would be much more common in the supermarket than it was in the mall.
Anecdotal Observations
- As I was collecting data, I noticed that teenagers –whose data are excluded from this study and were not recorded– wore masks much less often than adults. At times, the attitude of these youngsters appeared somewhat defiant; for instance, they were engaging in public group hugs. Had I added the data from teenagers, the mask-wearing proportion would have been lower than 40%.
- Some people are very careful: they wear a mask, clean their hands and their shopping cart. Other people are not careful at all. The individual differences are substantial.
- When people were wearing a mask, they usually did so correctly. Only 10 out of 185 people (about 5%) wore the mask incorrectly, and this was obvious from afar.
- The recommended distance of 1.5 m is not respected. There are too many people in a space that is too narrow, without effective guidelines for crowd movement in place. In my experience, this is the case almost everywhere you go in The Netherlands.
- Without sitting down with pen and paper and actually tallying the numbers, it is easy to overestimate the proportion of people who wear masks, possibly because masks stand out more.
Disclaimer
This is a hobby project that took only three hours, two eyes, and one pen. Serious scientific conclusions clearly require a much more extensive and systematic data collection effort. However, this project does demonstrate that it is relatively straightforward to assess the degree to which different COVID-related restrictions are being adopted by the population.
PS. Alex Reinhart attended me to the fact that the University of Maryland runs an international survey on mask usage. Their most recent data indicate a mask wearing percentage of 41% (!). (code:https://covidmap.umd.edu/api/r
References
Berger, J. O., & Wolpert, R. L. (1988). The likelihood principle (2nd ed.). Hayward (CA): Institute of Mathematical Statistics.
Gronau, Q. F., Raj, A., & Wagenmakers, E.-J. (2019). Informed Bayesian inference for the A/B test . Manuscript submitted for publication. https://arxiv.org/abs/1905.02068
Wagenmakers, E.-J., Gronau, Q. F., & Vandekerckhove, J. (2019). Five Bayesian intuitions for the stopping rule principle . Manuscript submitted for publication. https://psyarxiv.com/5ntkd
About The Authors

Eric-Jan Wagenmakers
Eric-Jan (EJ) Wagenmakers is professor at the Psychological Methods Group at the University of Amsterdam.


