The small plastic dome containing a die in the popular game “Mens Erger Je Niet!” (“Don’t Get So Annoyed!”) causes a bias — the die tends to land on the side opposite to how it started. This was not our initial hypothesis, however…
The 106-year old game “Mens Erger Je Niet!” (a German invention) involves players tossing a die and then moving a set of tokens around the board. The winner is the person who first brings home all of his tokens. The English version is known as Ludo, and the American versions are Parcheesi and Trouble. The outcry “Mens Erger Je Niet!” translates to “Don’t Get So Annoyed!”, because it is actually quite frustrating when your token cannot even enter the game (because you fail to throw the required 6 to start) or when your token is almost home, only to be “hit” by someone else’s token, causing it to be sent all the way back to its starting position.
Some modern versions of the game come with a “die machine”; instead of throwing the die, players hit a small plastic dome, which makes the die inside jump up, bounce against the dome, spin around, and land. But is this dome-die fair? One of us (EJ) who had experience with this machine felt that although the pips may come up about equally often, there would be a sequential dependency in the outcomes. Specifically, EJ’s original hypothesis was motivated by the observation that the dome sometimes misfires — it is depressed but the die does not jump. In other words, a “1” is more likely to be followed by a “1” than by a different number, a “2” more likely to be followed by a “2”, etc. Some of this action can be seen in the gif below:
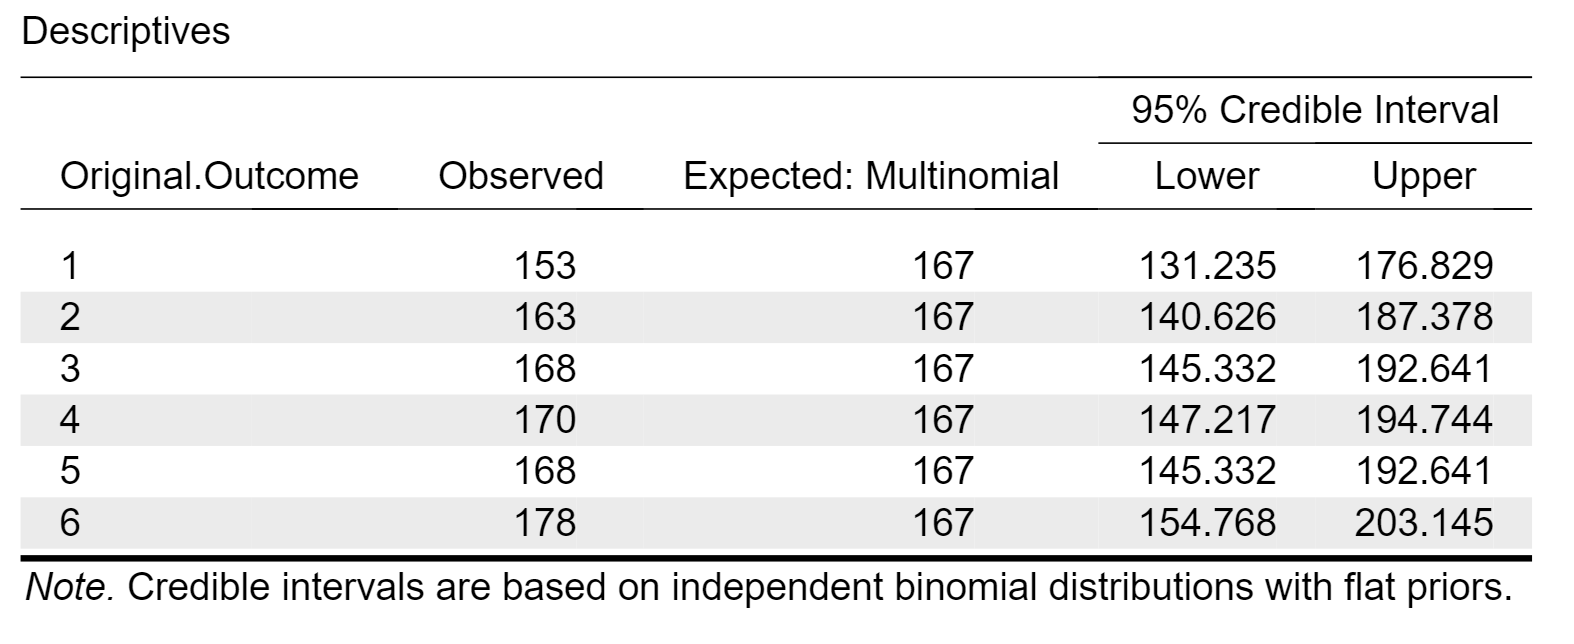
To study this important matter in greater detail, one of us (EJ still) “threw” the die 1000 times. First we’ll use the Bayesian multinomial test in JASP to confirm that the pip numbers are about equal. The descriptives table looks as follows:
The associated figure suggests that nothing spectacular is going on:
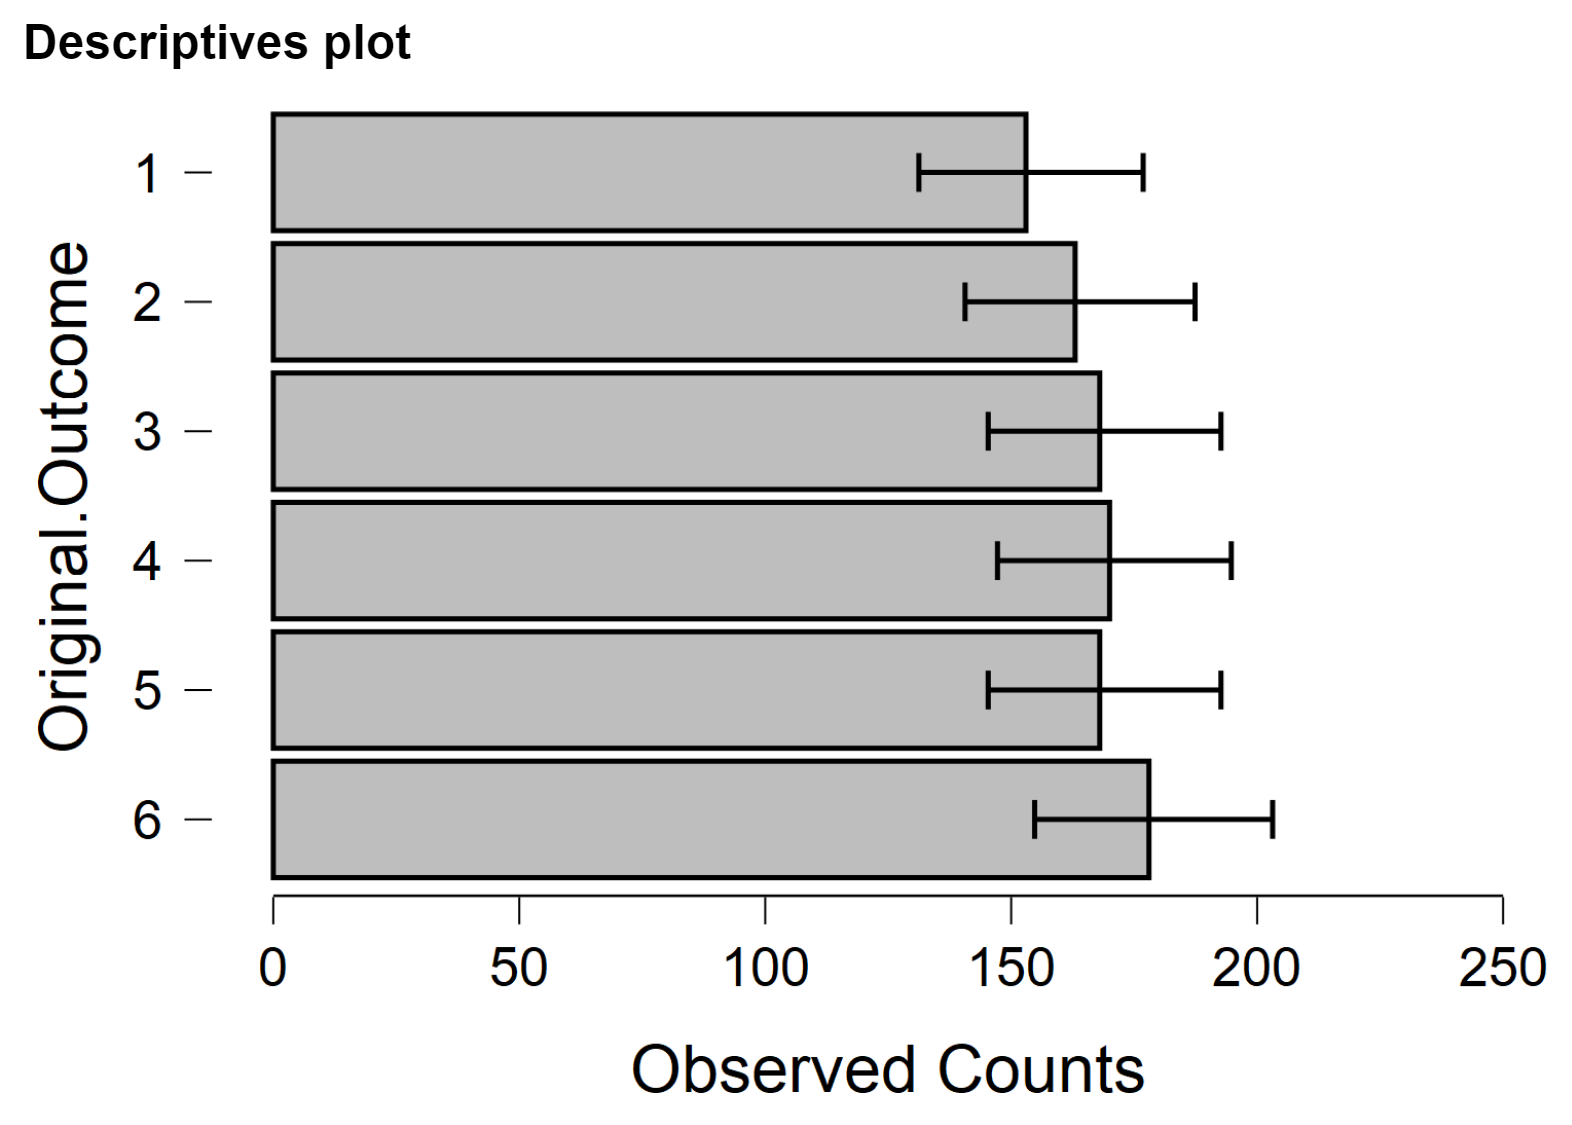
And indeed the default Bayes factor is 200,000 in favor of the null hypothesis of equal proportions.
The crucial hypothesis, however, was that there would be a preponderance of repeats. As it turned out, this hypothesis was strongly contradicted by the data. One of us (Quentin) analyzed the transition matrix and discovered that, instead, there is a preponderance of “opposites”.
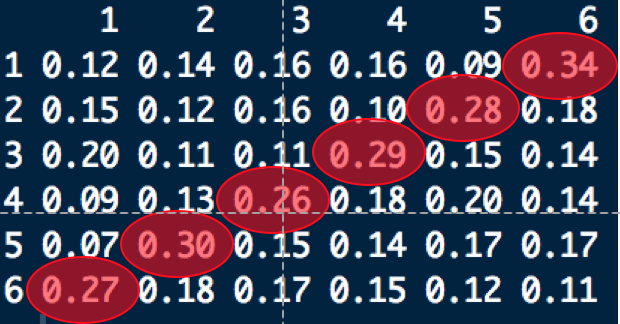
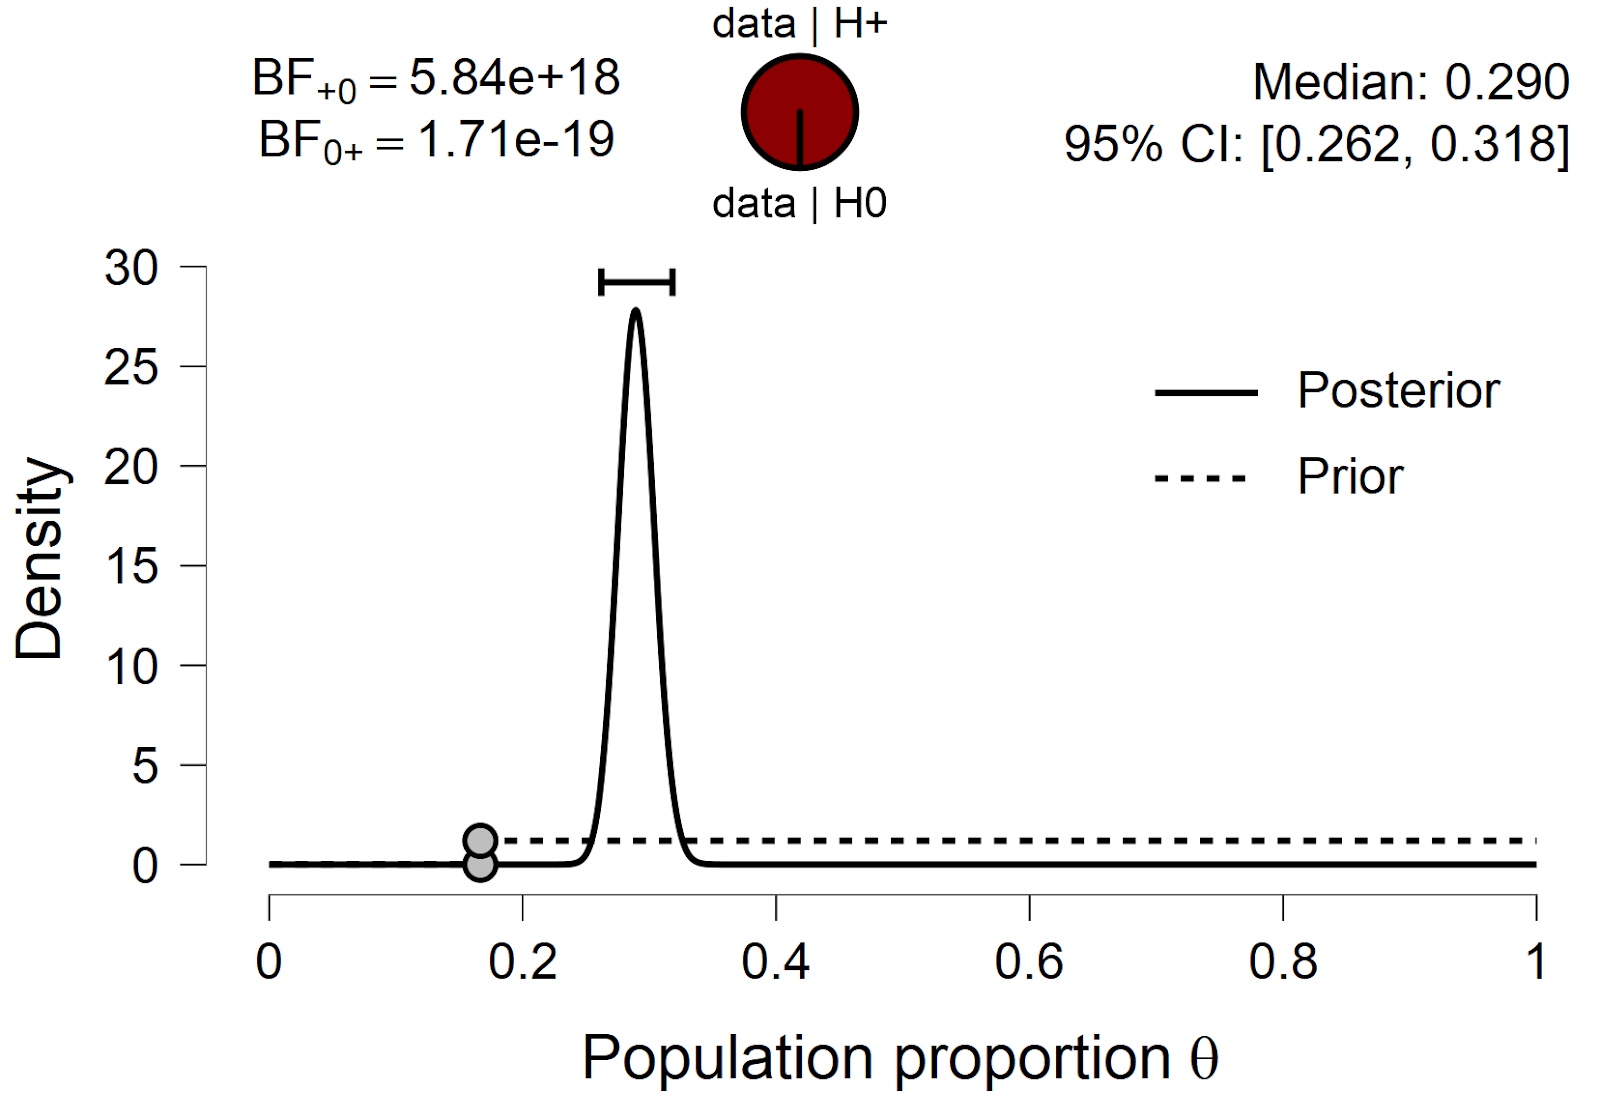
For instance, a throw showing a “6” (the pip count on its upper side) tended to be followed by a throw showing a “1” (which had been the pip count on the lower side). In general, the pips on the upper and lower side add to 7. If the die is fair, such “opposite outcomes” should occur with probability 1/6 or 0.1667. However, the actual sequence of 999 opportunities yielded 289 opposites, almost twice as many as expected if the die were fair. A default one-sided binomial test in JASP yields overwhelming evidence against the fair die hypothesis and in favor of the opposite-hypothesis:
With the power of hindsight, the opposite-hypothesis makes some sense: as the die jumps up, it spins and hits the dome before it has made a complete turn; the dome prevents complete turns and biases the die toward half-turns. However, the opposite-hypothesis was unexpected and post-hoc — it was completely motivated by the data that were then used to test it. So how should we assess the evidence in favor of the opposite-hypothesis?
From a purely subjective Bayesian perspective, the evidence is the evidence, and the data are really 5840000000000000000 times more likely under the opposite-hypothesis than under the fair-die hypothesis, no matter how the opposite-hypothesis was obtained. But posterior plausibility is a combination of evidence and prior plausibility. What is the prior plausibility of the opposite-hypothesis? Well, it is difficult to say, mainly because hindsight bias will cloud our judgment (which is why preregistration is helpful, even for Bayesians). It does seem likely, however, that the prior probability for the opposite-hypothesis is larger than 1 in 100,000, which would still make its posterior plausibility near 1.
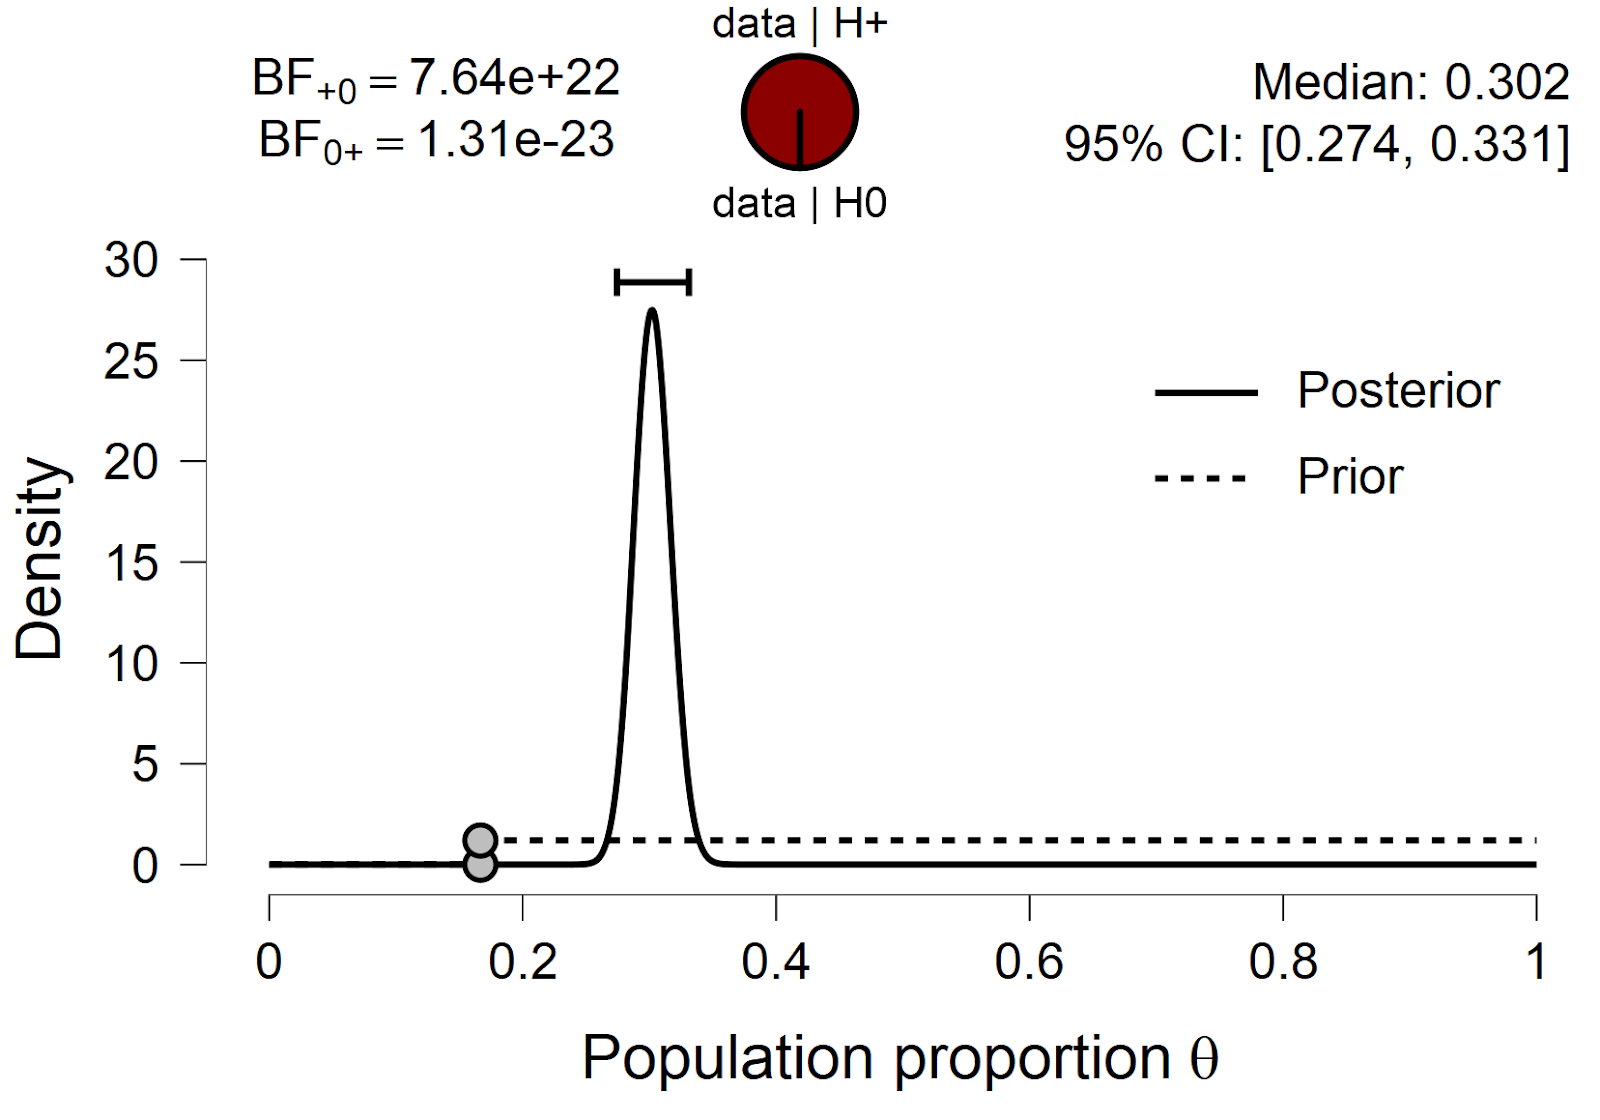
However, to make absolutely sure, one of us (EJ) tossed the die some more — this time, for 1001 throws. Again, the data supported the hypothesis that the pip numbers are uniform (results not shown). For the hypothesis under scrutiny, out of a total possible 1000 opportunities, 302 were opposites. The evidence is again overwhelming:
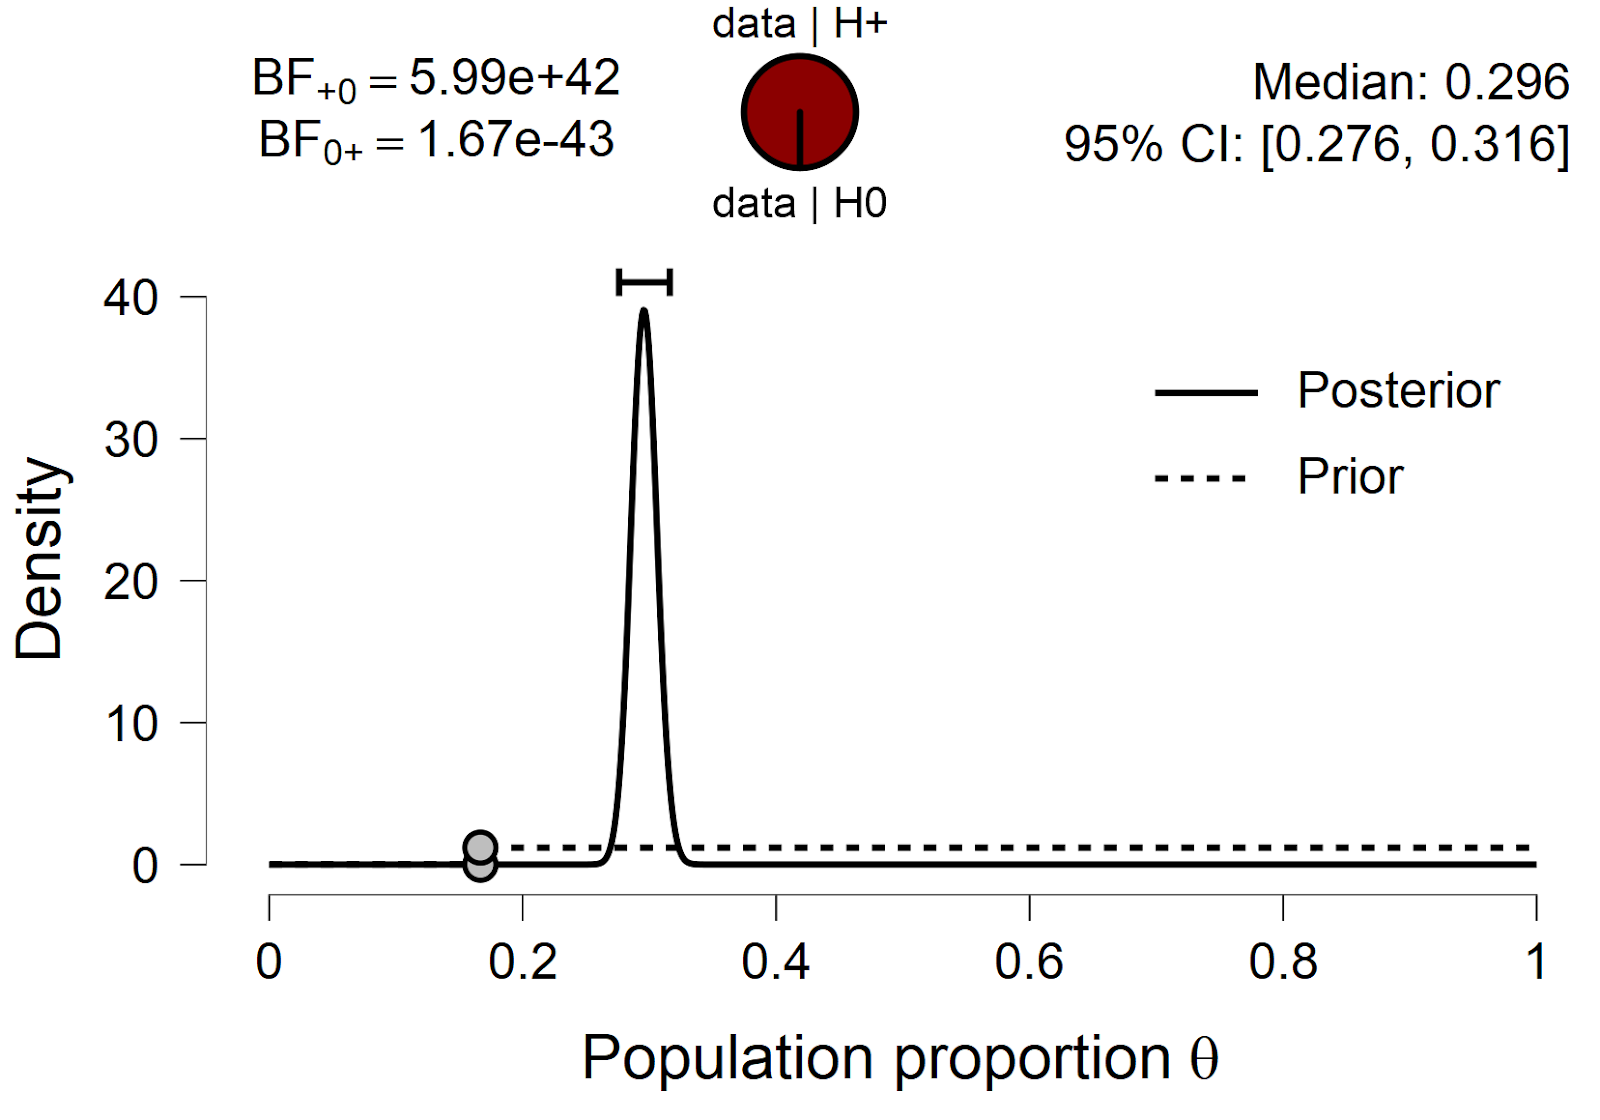
This is a compelling replication of a surprising result — and one of the first that we have been able to demonstrate in our lab. For completeness, we also give the result for the combined data set, when all data are analysed simultaneously. Then, among 1999 opportunities, 591 are opposites, for a proportion near .30, almost twice as high as expected under the fair-die hypothesis. The evidence is overwhelming:
Although the replication experiment was not strictly necessary –the evidence was too strong, the opposite-hypothesis too plausible– it does reassure us. Based on the Bayes factor for the complete data set, and the Bayes factor for the original data set, we could compute the replication Bayes factor, that is, the evidence that the second data set adds on top of the first (Ly et al., 2019). The .jasp file containing the analyses and the data can be obtained from https://osf.io/swczj/.
References
Ly, A., Etz, A., Marsman, M., & Wagenmakers, E.-J. (2019). Replication Bayes factors from evidence updating. Behavior Research Methods, 51, 2498-2508.
About The Authors

Eric-Jan Wagenmakers
Eric-Jan (EJ) Wagenmakers is professor at the Psychological Methods Group at the University of Amsterdam.

Quentin F. Gronau
Quentin is a PhD candidate at the Psychological Methods Group of the University of Amsterdam.


