
This post summarizes the content of an article that is in press for Advances in Methods and Practices in Psychological Science.1 The preprint is available on PsyArXiv.
In the traditional statistical framework, nonsignificant results leave researchers in a state of suspended disbelief. This study examines, empirically, the treatment and evidential impact of nonsignificant results. Our specific goals were twofold: to explore how psychologists interpret and communicate nonsignificant results, and to assess how much these results constitute evidence in favor of the null hypothesis. Firstly, we examined all nonsignificant findings mentioned in the abstracts of the 2015 volume of Psychonomic Bulletin & Review, Journal of Experimental Psychology: General, and Psychological Science (N = 137). In 72% of cases, nonsignificant results were misinterpreted, in the sense that authors inferred that the effect was absent. Secondly, a Bayes factor reanalysis revealed that fewer than 5% of the nonsignificant findings provided strong evidence (i.e., BF01 > 10) in favor of the null hypothesis compared to the alternative hypothesis. We recommend that researchers expand their statistical toolkit in order to correctly interpret nonsignificant results and to be able to evaluate the evidence for and against the null hypothesis.
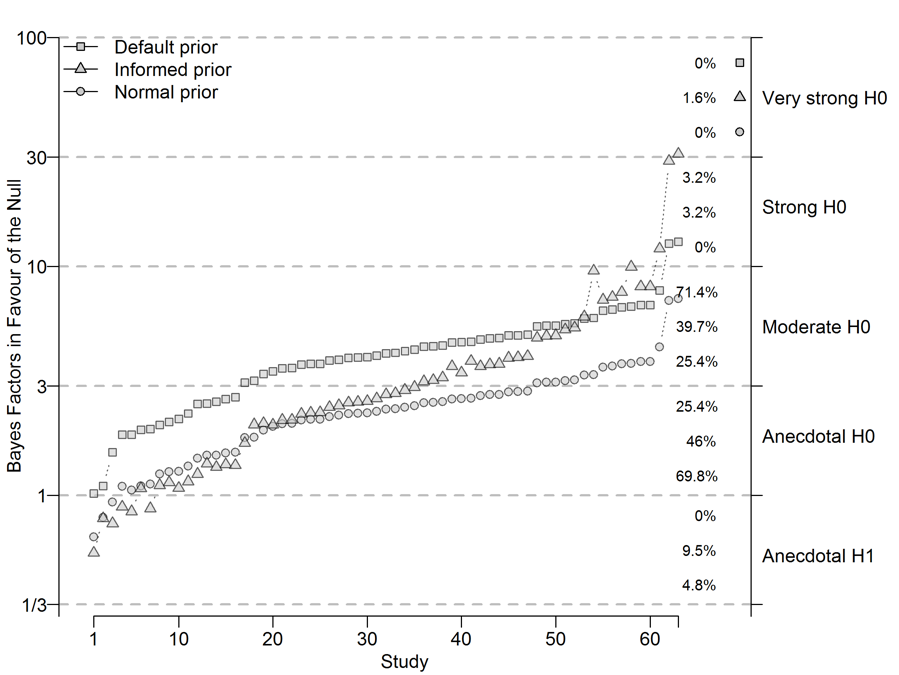
Figure 1. Three different Bayes factors in favor of the null hypothesis for each of the 63 nonsignificant t-tests reported in the selected literature. The Bayes factors were calculated with default, informed, and normal prior specifications of the alternative hypothesis. Note that the scaling of the y-axis has been loge transformed to help visualize the relationship. The right-hand side of the y-axis represents Jeffreys’ (1961) classification scheme. Within each region, the numbers describe the proportion of all results falling in that category when using default, informed, and normal prior specifications, respectively. The figure is reproduced from: https://doi.org/10.6084/m9.figshare.5721076.v2.
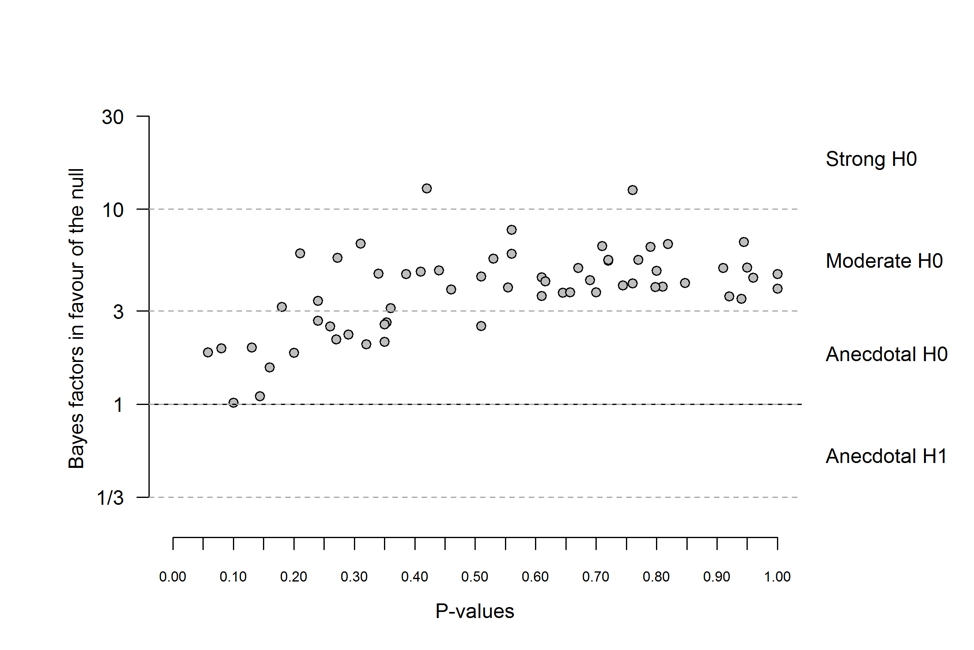
Figure 2. Relationship between the p-values and the corresponding default BF01S ( = .38, 95% CI [.20, .52]). Note that the scaling of the y-axis has been loge transformed to help visualize the relationship. Dots situated above the bold vertical line indicate evidence for the null hypothesis. The figure is reproduced from: https://doi.org/10.6084/m9.figshare.5721076.v2.
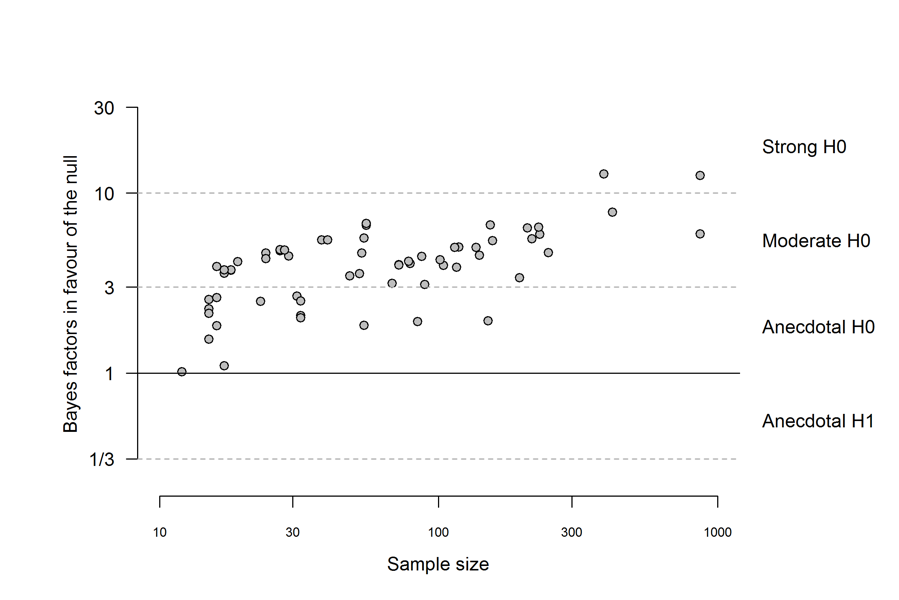
Figure 3. The relationship between the sample sizes of the investigated studies and the corresponding BF01S ( = .45, 95% CI [.26, .59]). Both of the scaling factors of the axes are loge transformed. The figure is reproduced from: https://doi.org/10.6084/m9.figshare.5721076.v2.
Like this post?
Subscribe to the JASP newsletter to receive regular updates about JASP including all its Bayesian analyses! You can unsubscribe at any time.References
Aczel, B., Palfi, B., Szollosi, A., Kovacs, M., Szaszi, B., Szecsi, P., Zrubka, M., Gronau, Q. F., van den Bergh, D., & Wagenmakers, E.-J. (in press). Quantifying Support for the Null Hypothesis in Psychology: An Empirical Investigation. Advances in Methods and Practices in Psychological Science.
Footnotes
1 The blog post is a direct copy from the article.
About The Author

Balazs Aczel
Balazs Aczel is associate professor at ELTE University in Budapest, Hungary. For more information about Balazs, you can visit his Website or his Twitter.


