Available on https://psyarxiv.com/fs562, this is a Bayesian analysis of the Pfizer Phase 3 clinical trial on a vaccine against COVID-19. Alternative analyses have been presented by Bob Carpenter, Sebastian Kranz, and Chuck Powell.
On Monday November 9th 2020, Pfizer and BioNTech issued a press release1 in which Pfizer CEO Dr. Albert Bourla stated: “Today is a great day for science and humanity. The first set of results from our Phase 3 COVID-19 vaccine trial provides the initial evidence of our vaccine’s ability to prevent COVID-19”. But what exactly are the initial data, and how strong is the initial evidence? From the press release we learn that “The case split between vaccinated individuals and those who received the placebo indicates a vaccine efficacy rate above 90%, at 7 days after the second dose. This means that protection is achieved 28 days after the initiation of the vaccination, which consists of a 2-dose schedule.” We are also told that “the evaluable case count reached 94”, and Prof. Ugur Sahin, BioNTech CEO, tells us that “We will continue to collect further data as the trial continues to enroll for a final analysis planned when a total of 164 confirmed COVID-19 cases have accrued.” Finally, the press release states that “The Phase 3 clinical trial of BNT162b2 began on July 27 and has enrolled 43,538 participants to date, 38,955 of whom have received a second dose of the vaccine candidate as of November 8, 2020”.
For our Bayesian interim analysis, we will assume that the placebo and vaccinated groups are equally large. This is consistent with the random assignment outlined in the study protocol2. We do not know how many participants exactly are in the analyzed sample but we do know that this number must be lower than 38,955. For simplicity we assume that the “over 90%” vaccine efficacy is based on 16,000 participants in each group for a total sample size of 32,000 (the results are qualitatively invariant under reasonable choices). We also assume that out of the 94 cases, 86 occurred in the control group and 8 occurred in the vaccinated group, as this yields a vaccine efficacy rate of 91%. Statistically we are faced therefore with a comparison between two proportions: 86/16,000 in the control group and 8/16,000 in the vaccinated group.
To quantify the evidence for vaccine efficacy we conducted a Bayesian logistic regression with group membership as the predictor variable.3,4 Under the no-effect model H0, the log odds ratio equals ψ=0, whereas under the positive-effect model H+, ψ is assigned a positive-only normal prior N+(μ,σ), reflecting the fact that the hypothesis of interest (i.e., the vaccine is helpful, not harmful) is directional. A default analysis (i.e., μ=0, σ=1) reveals overwhelming evidence for H+.5 Specifically, the observed data are about 97 trillion times more likely under H+ than under H0. Disregarding H0 for the purpose of parameter estimation, Figure 1 shows the prior and posterior distribution for the log odds ratio under a nondirectional alternative hypothesis. Although there remains considerable uncertainty about the exact size of the effect, it is almost certainly very large.
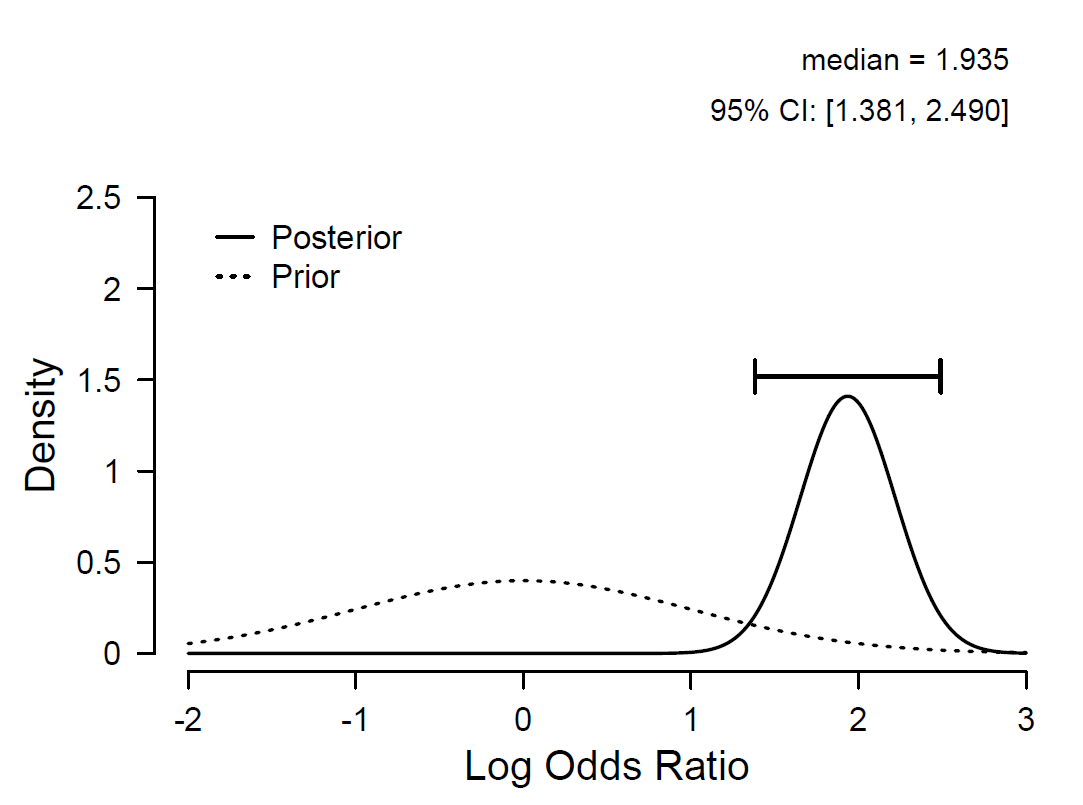
Figure 1. The posterior distribution for the log odds ratio ψ shows that the effect of vaccination is likely to be very large. It is 95% probable that the true value of ψ falls in between 1.4 and 2.5. Figure from JASP (jasp-stats.org).
The same information is presented in Figure 2, but now on the probability scale. The separation between the posterior distributions for the two groups is considerable, and the infection rate for the vaccinated group is relatively low.
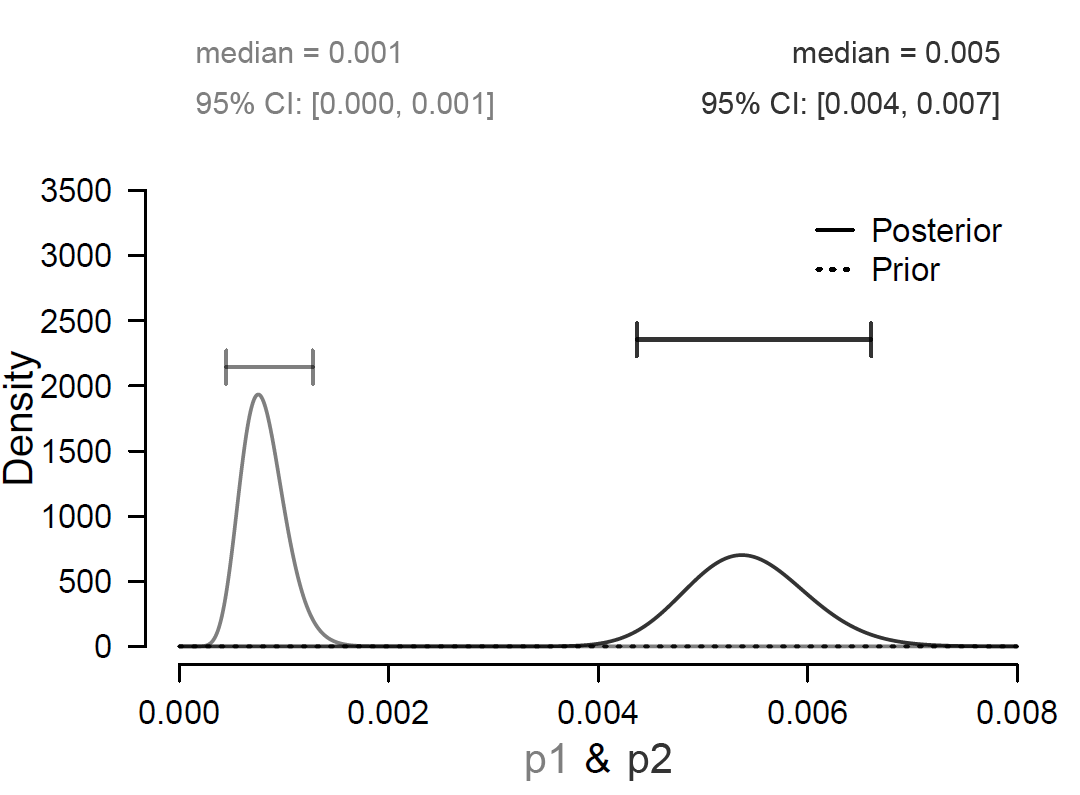
Figure 2. The difference between the two posterior distributions indicates the size of the effect on the probability scale. The gray “p1” and the black “p2” indicate the COVID-19 infection rate in the vaccinated group and the placebo group, respectively. Figure from JASP (jasp-stats.org).
The Pfizer press release reported the sample vaccine efficacy rate, which is one minus the relative risk. Figure 3 shows the prior and posterior distribution for the relative risk. In our model, the posterior median for the population vaccine efficacy rate equals 1-0.145 = 0.855, with an associated 95% central credible interval ranging from 1-0.251 = 0.749 to 1-0.084 = 0.916.
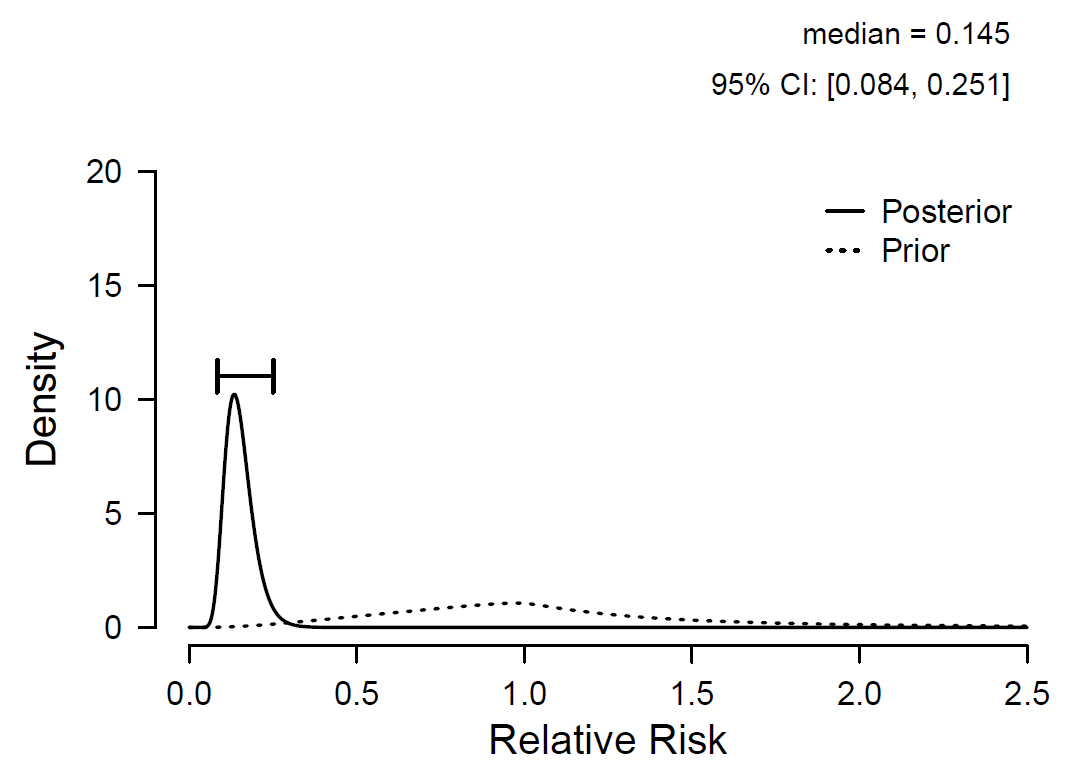
Figure 3. Prior and posterior distribution for relative risk. One minus relative risk equals the vaccine efficacy rate. Figure from JASP (jasp-stats.org).
In sum, the Pfizer interim Phase 3 data are indeed highly promising. Even though the case numbers are relatively small, their distribution across the placebo and vaccinated group is so lopsided that (1) the evidence in favor of effectiveness is overwhelming; (2) the effect is almost certainly very large, although how large exactly is difficult to tell.
References
- Pfizer and Biontech announce vaccine candidate against COVID-19 achieved success in first interim analysis from phase 3 study. Press release available at https://www.pfizer.com/news/press-release/press-release-detail/pfizer-and-biontech-announce-vaccine-candidate-against.
- Pfizer. A phase 1/2/3 study to evaluate the safety, tolerability, immunogenicity, and efficacy of RNA vaccine candidates against COVID-19 in healthy individuals. Study protocol available at https://pfe-pfizercom-d8-prod.s3.amazonaws.com/2020-11/C4591001_Clinical_Protocol_Nov2020.pdf.
- Kass RE, Vaidyanathan SK. Approximate Bayes factors and orthogonal parameters, with application to testing equality of two binomial proportions. Journal of the Royal Statistical Society: Series B (Methodological) 1992;54:129-44.
- Gronau QF, Raj K. N. A., Wagenmakers EJ. (2019). Informed Bayesian inference for the A/B test. Manuscript submitted for publication and available on arXiv: http://arxiv.org/abs/1905.02068
- Jeffreys, H. Theory of Probability. 1st ed. Oxford University Press, Oxford, UK, 1939.
About The Authors

Eric-Jan Wagenmakers
Eric-Jan (EJ) Wagenmakers is professor at the Psychological Methods Group at the University of Amsterdam.

Quentin F. Gronau
Quentin is a PhD candidate at the Psychological Methods Group of the University of Amsterdam.