
This post summarizes the content of an article that is in press for Behavior Research Methods. The preprint is available on PsyArXiv.
Psychological experiments often yield data that are hierarchically structured. A number of popular shortcut strategies in cognitive modeling do not properly accommodate this structure and can result in biased conclusions. First, we considered a modeling strategy that ignores the hierarchical data structure, missing random effects on the participant-level. Our theoretical analysis indicates that this biases statistical results towards the null hypothesis. Second, we considered a modeling strategy that takes a two-step approach by first obtaining participant-level estimates from a hierarchical cognitive model and subsequently using these estimates in a follow-up statistical test. Our theoretical analysis indicates that this biases statistical results towards the alternative hypothesis. Using a simulation study for a two-group experiment, we demonstrate that both strategies result in considerable statistical biases when parameter estimation is based on little data; only hierarchical models of the multilevel data lead to correct conclusions. These results are particularly relevant for applications of hierarchical Bayesian cognitive models in settings with limitations on the size of the available data sets, such as clinical studies.
FILLER
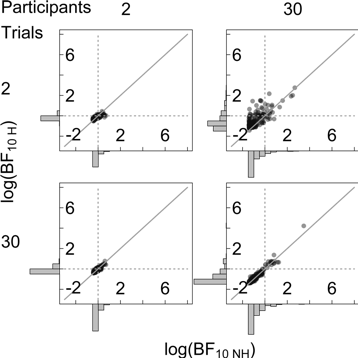
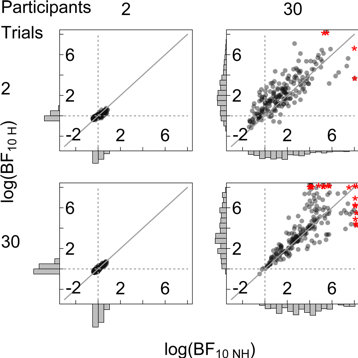
Figure 1. Outcomes of the Bayesian analysis under the correct hierarchical (H, y-axis) and shortcut non-hierarchical (NH, x-axis) Bayesian model for different numbers of simulated trials and participants. The gray diagonal line shows where log-Bayes factors should fall in the case of equality (logBF10 H = logBF10 NH). Left: True difference in group means is 0. When the number of participants is large and the number of trials per participant is low non-hierarchical Bayes factors are biased towards the null hypothesis (top right panel). Right: True difference in group means is 1SD. When the number of participants is large and the number of trials per participant is low non-hierarchical Bayes factors are biased towards the null hypothesis (top right panel).
FILLER
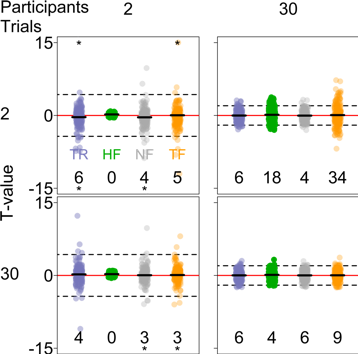
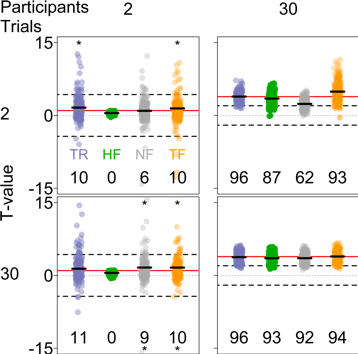
Figure 2. Outcomes of the frequentist analysis for different numbers of simulated trials and participants. Dotted lines show t = 0, dashed lines show the critical t-value in a two-sided t-test with α = .05, and red lines show the theoretical t-value. Left: True difference in group means is 0. Right: True difference in group means is 1SD. True t-values are shown in blue (TR). T-values based on group-level estimates from hierarchical Bayesian model, shown in green (HF), cluster tightly around 0 if the number of participants is low (left column in both plots). T-values based on participant means, shown in gray (NH), are biased towards the null hypothesis when the number of trials per participant is small and the number of participants is large (top right panel, right plot). T-values from a two-step analysis, shown in orange (TF), are biased towards the alternative hypothesis when the number of trials per participant is small and the number of participants is large (top right panel, left plot).
References
Boehm, U., Marsman, M., Matzke, D., & Wagenmakers, E.-J. (in press). On the importance of avoiding shortcuts in applying cognitive models to hierarchical data. Behavior Research Methods. Preprint.
About The Author

Udo Boehm
Udo Boehm is postdoctoral researcher at the Department of Psychological Methods at the University of Amsterdam.


