This post is an extended synopsis of a preprint that is available on arXiv: http://arxiv.org/abs/1905.02068
Abstract
Booming in business and a staple analysis in medical trials, the A/B test assesses the effect of an intervention or treatment by comparing its success rate with that of a control condition. Across many practical applications, it is desirable that (1) evidence can be obtained in favor of the null hypothesis that the treatment is ineffective; (2) evidence can be monitored as the data accumulate; (3) expert prior knowledge can be taken into account. Most existing approaches do not fulfill these desiderata. Here we describe a Bayesian A/B procedure based on Kass and Vaidyanathan (1992) that allows one to monitor the evidence for the hypotheses that the treatment has either a positive effect, a negative effect, or, crucially, no effect. Furthermore, this approach enables one to incorporate expert knowledge about the relative prior plausibility of the rival hypotheses and about the expected size of the effect, given that it is non-zero. To facilitate the wider adoption of this Bayesian procedure we developed the abtest package in R. We illustrate the package options and the associated statistical results with a synthetic example.
Example: Effectiveness of Resilience Training
Suppose the managers of a large consultancy firm are interested in reducing the number of employees who quit within the first six months, possibly due to the high stress involved in the job. A coaching company offers a resilience training and claims that this training greatly reduces the number of employees who quit. Implementing the training for all newly hired employees would be expensive and some of the managers are not completely convinced that the training is at all effective. Therefore, the managers decide to run an A/B test where half of a sample of newly hired employees will receive the training, the other half will not be trained. The dependent variable is whether or not an employee quit within the first six months (1 = still on the job, 0 = quit).
Prior Elicitation
Before commencing the A/B test, the managers ask the coaching company to specify how effective they believe the training will be. The coaching company claims that, based on past experience with the training, they expect the proportion of employees who do not quit within the first six months to be 15% larger for the group who received the training, with a 95% uncertainty interval ranging from a 2.5% benefit to a 27.5% benefit. The elicit_prior function can be used to encode this prior information, and the plot_prior function can be used to visualize the prior (Figure 1).
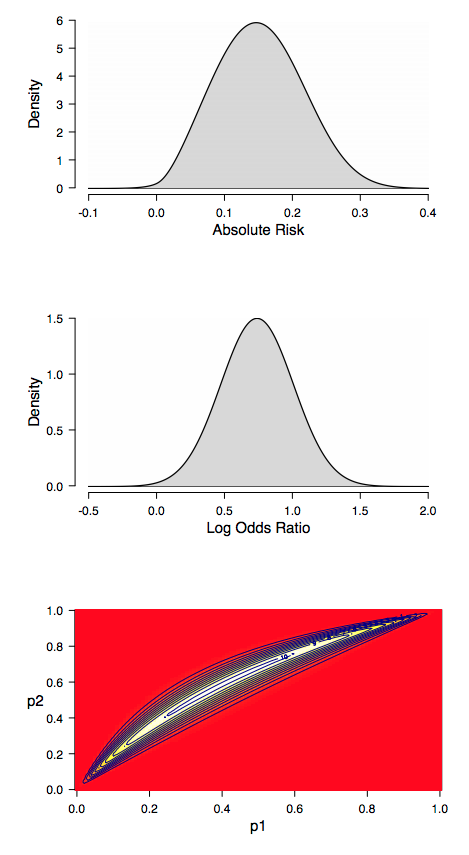
Figure 1. Elicited (implied) prior distributions for the effectiveness of the resilience training. The top panel displays the prior distribution for the absolute risk which corresponds to the difference between the probability of still being on the job for the trained and the non-trained employees (i.e., 


Hypothesis Testing
After having specified the prior distribution for the test-relevant parameter, the consultancy firm starts to collect data. Figure 2 displays the result of a sequential analysis of these data (obtained using the ab_test function and, subsequently, the plot_sequential function). The posterior probability of each hypothesis with non-zero prior probability is plotted as a function of the total number of observations. At the top, two probability wheels visualize the prior probabilities of the hypotheses and the posterior probabilities of the hypotheses based on all available data. Figure 2 shows that after some initial fluctuation, adding more observations increased the probability of the null hypothesis that there is no effect of the training.
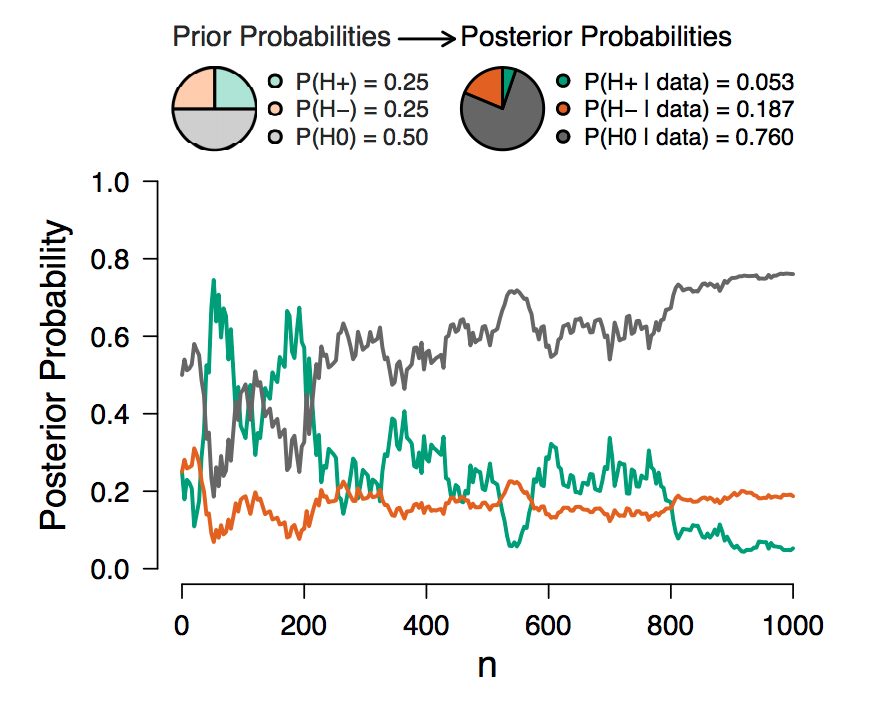 Figure 2. Sequential analysis results. The posterior probability of each hypothesis is plotted as a function of the number of observations across groups. On top, two probability wheels visualize the prior probabilities of the hypotheses and the posterior probabilities after taking into account all observations.
Parameter Estimation
The data indicate evidence in favor of the null hypothesis versus the hypothesis that the training is highly effective, leaving open the possibility that the training does have an effect, but of a more modest size than the company anticipated. To assess this possibility one may investigate the potential size of the effect under the assumption that the effect is non-zero. The plot_posterior function can be used to visualize the posterior distribution (Figure 3).
In sum, this synthetic data set offers modest evidence in favor of the null hypothesis which states that the training is not effective over the hypothesis that the training is highly effective; nevertheless, the consultancy firm should probably continue to collect data in order to obtain more compelling evidence before deciding whether or not the training should be implemented. Note that continued testing is trivial in the Bayesian framework: the results can simply be updated as new observations arrive.
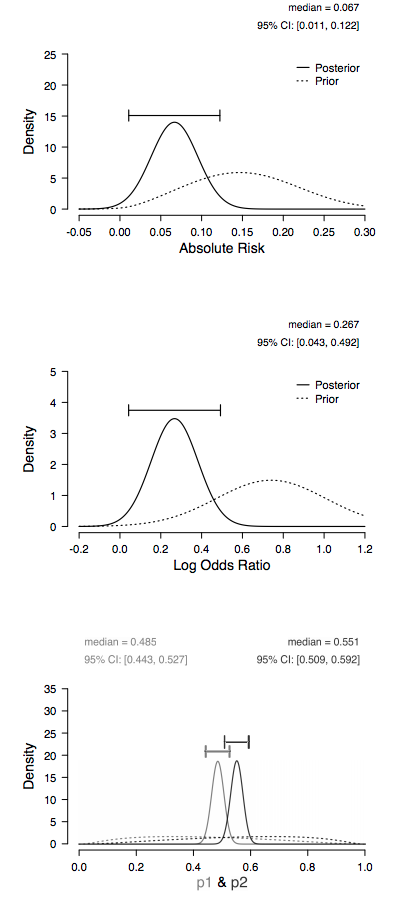
Figure 3. (Implied) prior and posterior distributions under 
Concluding Comments
A/B testing is ubiquitous in business and medicine. Here we have demonstrated how the abtest package enables relatively complete Bayesian inference including the capability to obtain support for the null, continuously monitor the results, and elicit and incorporate expert prior knowledge. Hopefully, this approach forms a basis for evidence-based conclusions that will benefit both businesses and patients.
References
Gronau, Q. F., Raj K. N., A., & Wagenmakers, E.-J. (2019). Informed Bayesian inference for the A/B test. Manuscript submitted for publication and available on arXiv: http://arxiv.org/abs/1905.02068
Kass, R. E., & Vaidyanathan, S. K. (1992). Approximate Bayes factors and orthogonal parameters, with application to testing equality of two binomial proportions. Journal of the Royal Statistical Society, Series B, 54, 129-144.
About The Author

Quentin Gronau
Quentin is a PhD candidate at the Psychological Methods Group of the University of Amsterdam.

Akash Raj
Software engineer for JASP.

Eric-Jan Wagenmakers
Eric-Jan (EJ) Wagenmakers is professor at the Psychological Methods Group at the University of Amsterdam.


