
This post was written the week before the birth of our daughter Leanne, who finally decided to make an appearance on Valentine’s Day this year.
Nataschja is lying on our sofa, watching a series on Netflix. It is Tuesday afternoon and I am working from home. In fact, I have been working from home for about a week now, awaiting the birth of our daughter. Both Nataschja and I are getting impatient, and the uncertainty surrounding the timing of the birth isn’t helping. Non-medical labor can start anywhere from week 37 to week 42, and that is a pretty wide time window.
A week ago I still felt relatively certain that our daughter would be born either on the due date or a few days early — after all, our son Theo was born three days before the due date (that’s after 39 weeks and 4 days). Surely there must be some correlation between labor onsets of siblings? I had asked our midwife about this, but she replied that, within the non-medical window, the timing of births is just unpredictable.
As the days went by, and our daughter didn’t budge, my interest in the correlation between the timing of first and second births increased. At some point I started a Google search and landed on a website that provided a data set of 1122 women and the length of their pregnancy for their firstborn and their second. The website asked the right question: “if your first baby is early will your second baby be early?”; the answer provided was that “On average, the mothers in this survey had their subsequent babies 0.06 days later than the baby before it.”
More can be done with these data, and below I’ll provide a few analyses that I conducted in JASP. An annotated .jasp file can be found here: NB: the output is viewable from your browser, as the Open Science Framework has a JASP viewer. [The .jasp file presents a series of sequential analyses that suggests the data were organized in a systematic way, but here we’ll ignore that and just focus on the overall result.]
First, consider the descriptives:
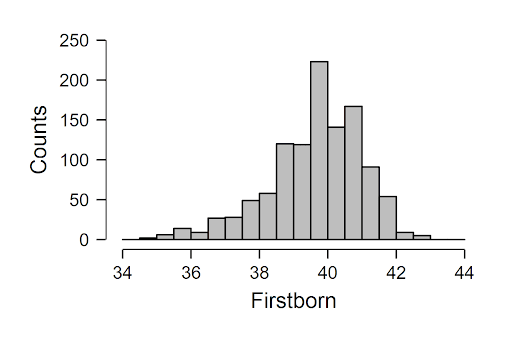
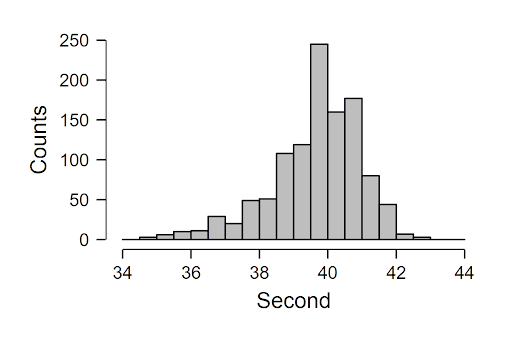
The histograms show that, indeed, there is a lot of variation between mothers in terms of pregnancy length. Nevertheless, the distribution is not flat, and births near the due date are more likely than those further away (no surprises there).
Now for the key analysis: if your first baby is early, will your second baby be early? First let’s see the scatterplot:
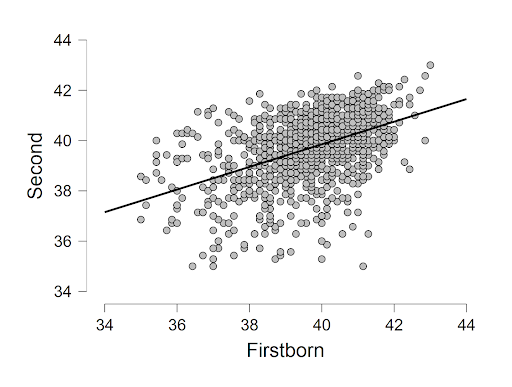
The scatterplot shows that there is a positive relation between the pregnancy lengths. The sample correlation coefficient is 0.46. However, much uncertainty remains. For instance, if the firstborn arrived after 39 weeks and 4 days, say, this still leaves open a wide range of birth dates for the second baby.
Now let’s do some Bayesian inference. With a single mouse click we obtain the following result:
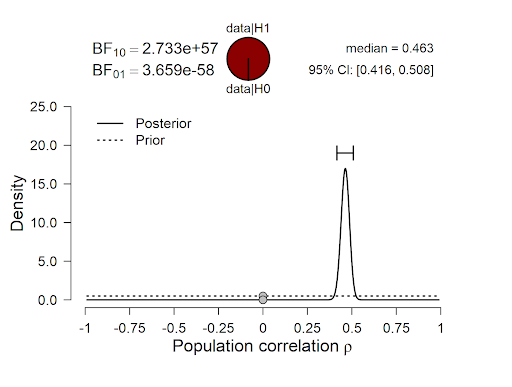
Does a hypothesis test against a correlation of zero make sense here? With the power of hindsight, it is easy to say that the test is redundant: of course the consecutive pregnancy lengths are associated! However, the website that presented the data wasn’t clear on this; before I saw the data I personally believed that the absence of a correlation would be highly surprising, but I would not have been willing to literally bet my house on it. The results are abundantly clear: the 95% central credible interval ranges from 0.42 to 0.51, and the data are about 2700000000000000000000000000000000000000000000000000000000 times more likely under H1 than under H0. By the way, this is considered overwhelming support 🙂
We could conduct a one-sided test; the posterior distribution will not change (well, it will change a tiny bit, because the negative posterior mass is eliminated and the positive posterior mass is correspondingly increased, but because the posterior is already almost completely on the positive values the change will be truly miniscule). The Bayes factor, however, will increase by a factor of two. This happens because by removing the negative values from the prior distribution, H1 stops making predictions that are completely off; with a symmetric prior, half of the predictions are completely off, and eliminating them increases the predictive performance of H1 by a factor of two.
So what have we learned? Well, the correlation between consecutive pregnancy lengths is likely to be somewhere in the .40-.50 range. This is not a particularly weak correlation, but eyeballing the scatterplot it does not seem to greatly reduce the uncertainty for Nataschja.
Postscriptum: Leanne was born six days after the due date.
About The Author


