This post is an extended synopsis of van Doorn, J. B., Matzke D., & Wagenmakers, E.-J. (in press). An In-Class Demonstration of Bayesian Inference. Psychology Learning and Teaching (https://doi.org/10.1177/14757
25719848574). Preprint available on PsyArXiv:https://psyarxiv.com/d8bvn/
Abstract
Over 80 years ago, Sir Ronald Fisher conducted the famous experiment “The Lady Tasting Tea” in order to test whether his colleague, Dr. Muriel Bristol, could taste if the tea infusion or the milk had been added to the cup firs. Dr. Bristol was presented with eight cups of tea and the knowledge that four of these had the milk poured in first. Dr. Bristol was then asked to identify these four cups. We revisit Fisher’s experimental paradigm and demonstrate how a similar tasting experiment, conducted in a classroom setting, can familiarize students with several key concepts of Bayesian inference, such as the prior distribution, the posterior distribution, the Bayes factor, and sequential analysis.
The Experiment
On a Friday afternoon, May 12th 2017, an informal beer tasting experiment took place at the Psychology Department of the University of Amsterdam. The experimental team consisted of three members: one to introduce the participants to the experiment and administer the test, one to pour the drinks, and one to process the data. Participants tasted two small cups filled with Weihenstephaner Hefeweissbier, one with alcohol and one without, and indicated which one contained alcohol. We note that beer can be substituted with anything else suitable (e.g., red and green M&M’s, Coca Cola and Pepsi, decaf and regular coffee).
The experiment was double-blind, such that the person administering the test and interacting with the participants did not know which of the two cups contained alcohol. For ease of reference, each cup was labeled with a random integer between 1 and 500, and each integer corresponded either to the alcoholic or non-alcoholic beer. A coin was flipped to decide which beer was tasted first.
Analysis
Of the 57 participants, 42 (73.7%) correctly identified the beer that contained alcohol: in other words, there were 


Chance performance corresponds to 


In order to analyze the collected data, the Bayesian binomial test in JASP can be used, which can be found under the menu labeled “Frequencies”. Several settings are available for the binomial test, allowing students to explore different analysis choices.
Figure 1 presents a screenshot of the options panel in JASP. For this analysis, we specify a test value of 


Figure 2 illustrates the results of the binomial test. Here we show the prior and the posterior distribution of 


The one-sided positive hypothesis (i.e., 


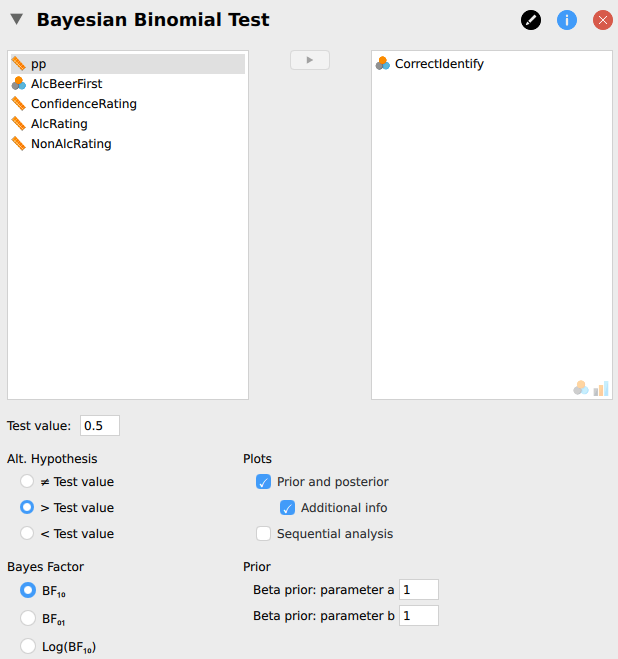
Figure 1. The input panel for the Bayesian binomial test in JASP. The upper left box displays all available variables. The upper right box displays the tested variables. Below are other options, such as setting the test value, the alternative hypothesis, and the shape parameters of the beta prior.
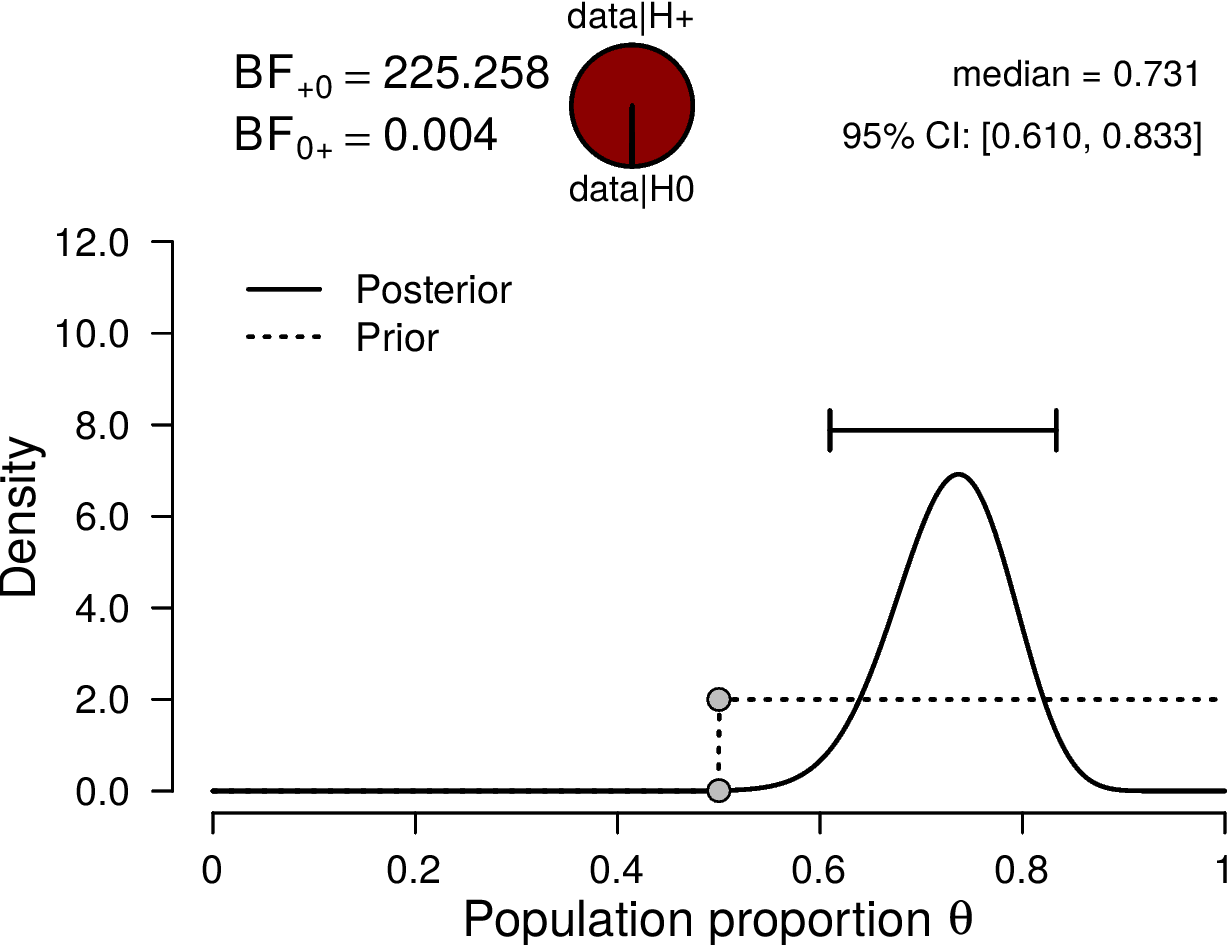
Figure 2. Bayesian binomial test for the rate parameter
Concluding Comments
This article has outlined a teaching tool for familiarizing students with the basics of Bayesian inference. The educational advantage of the Bayesian binomial test is that both the likelihood function and the parameterization of the prior and posterior distributions are intuitive and straightforward. The tasting experiment allows students to analyze their own data, collected on the fly, making the inferential process more concrete and relevant.
Table 1 summarizes the concepts that are introduced during the tasting experiment, as well as how these concepts can be practically demonstrated. The experiment is aimed at introducing college level students to these concepts. We have positive experiences using it as a teaching tool in both introductory workshops and undergraduate courses in Bayesian inference. We have created an Open Science Framework repository that contains the original data set, as well as a fully annotated JASP-file. The repository can be found at https://osf.io/428pb/. Finally, we would like to thank Ronald Fisher for proposing the experimental procedure, and Dennis Lindley for shedding a Bayesian light on it. Without their seminal works we would not have been able to conclude that most psychologists are able to taste the difference between alcoholic and non-alcoholic beer.
| Bayesian Concept | Demonstration |
|---|---|
| Irrelevance of sampling plan for Bayesian updating | Analyzing the data as they come in |
Evidence for is possible, as it is for  | Computing the Bayes factor |
| Conjugate prior distribution | Using the binomial likelihood to update a beta prior distribution |
| Savage-Dickey density ratio for computation of Bayes factors | Interpreting posterior plots (e.g., Figure 2) |
| Analysis of sensitivity of results to choice of prior distribution | Changing the parameters of the beta prior distribution and observing the corresponding changes in the posterior distribution and the Bayes factor |
| Bayesian one-sided testing | Specifying different alternative hypotheses |
| Principle of parsimony in Bayesian inference | Comparing two-sided results with one-sided results |
References
van Doorn, J.B., Matzke D., & Wagenmakers, E.-J. (in press). An In-Class Demonstration of Bayesian Inference. Psychology Learning and Teaching. Preprint available on PsyArXiv: https://psyarxiv.com/d8bvn/
Fisher, R. A. (1937). The design of experiments. Oliver And Boyd; Edinburgh;
London.
Lindley, D. V. (1993). The analysis of experimental data: The appreciation of
tea and wine. Teaching Statistics, 15 , 22–25.
About The Author

Johnny van Doorn
Johnny van Doorn is a PhD candidate at the Psychological Methods department of the University of Amsterdam.
Dora Matzke
Dora Matzke is an assistant professor at the Psychological Methods department of the University of Amsterdam.

Eric-Jan Wagenmakers
Eric-Jan (EJ) Wagenmakers is professor at the Psychological Methods Group at the University of Amsterdam.


